
/home/grassnews/public_html/wp-content/themes/zox-news/parts/post-single.php on line 153
">
Warning: Undefined array key 0 in /home/grassnews/public_html/wp-content/themes/zox-news/parts/post-single.php on line 153
Warning: Attempt to read property "cat_name" on null in /home/grassnews/public_html/wp-content/themes/zox-news/parts/post-single.php on line 153
Nutrien’s First Quarter Impacted by Harsh Weather; Maintains Guidance
All amounts are in US dollars
SASKATOON, Saskatchewan–(BUSINESS WIRE)–Nutrien Ltd. (Nutrien) announced today its 2019 first-quarter results,
with net earnings from continuing operations of $41 million ($0.07
diluted earnings per share). First-quarter adjusted net earnings was
$0.20 per share and adjusted EBITDA was $697 million.
Adjusted net earnings (total and per share amounts), adjusted EBITDA and
related annual guidance are non-IFRS financial measures. See pages 2 and
15 for further information.
“Nutrien’s first-quarter adjusted EBITDA was 22 percent higher than 2018
despite being impacted by the second wettest six-month period in the US
in 125 years. While some regions are still receiving excess moisture,
planting is underway and we expect strong crop input demand in the
second quarter. As such, we are maintaining our annual guidance for
2019,” commented Chuck Magro, Nutrien’s President and CEO.
“Our organization is focused on what it can control and how best to
deliver long-term value to stakeholders. In the first quarter, we
allocated almost $1 billion towards growing our Retail business in core
markets and repurchased over $800 million of our stock. We also continue
to pursue operational enhancements across our world-class integrated
network and to lead the way in digital transformation of the ag-retail
industry,” added Mr. Magro.

Highlights:
-
Retail EBITDA in the first quarter was lower compared to the same
period last year due to an extremely wet spring season and flooding in
parts of the US. Continued progress was made on Nutrien Ag Solutions
digital platform, with customers representing 58 percent of our North
American Retail sales signed up on the platform within nine months of
launch. -
Potash EBITDA was 41 percent higher in the first quarter compared to
the same period last year due to higher net selling prices and strong
offshore demand, partially offset by lower North American sales. -
Nitrogen EBITDA in the first quarter was slightly higher than the same
period last year due mainly to higher urea and UAN prices being offset
by lower total sales volumes resulting from the excess wet weather
across the US. -
We strengthened our US Retail business including the acquisitions of
Actagro, LLC, Van Horn, Inc., and Security Seed and Chemical, Inc.,
and completing the remainder of the Agrichem acquisition in Brazil
with combined annual revenue of approximately $400 million for these
businesses. We also entered into a binding agreement to acquire
Ruralco Holdings Limited, the third largest agriculture retailer in
Australia. -
Nutrien achieved $621 million in annual run-rate synergies as at March
31, 2019, surpassing the target of $600 million for the end of 2019.
This represents a 24 percent increase from the original target of $500
million and was achieved well ahead of schedule. -
Nutrien announced an additional five percent normal course issuer bid
program in February 2019 and to date, has repurchased approximately 21
million shares representing over 3 percent of Nutrien’s outstanding
shares. -
Nutrien full-year 2019 adjusted net earnings per share and adjusted
EBITDA guidance is maintained at $2.80 to $3.20 per share and $4.4
billion to $4.9 billion, respectively. First-half 2019 guidance is
provided at $1.75 to $1.95 adjusted net earnings per share. -
We have provided a new financial data tool on our website, allowing
stakeholders to view our historical annual and quarterly information
in an easy to use and downloadable format. It is located at: https://www.nutrien.com/interactive-datatool
Adjusted Net Earnings
| Three Months Ended March 31, 2019 | |||||||||
| Dollars (millions), except per share amounts |
Increases
(Decreases) |
Post-Tax |
Per
Diluted Share |
||||||
| Net earnings | $ | 41 | $ | 0.07 | |||||
| Adjustments: | |||||||||
| Merger and related costs | $ | 11 | 8 | 0.02 | |||||
| Share-based compensation | 57 | 44 | 0.07 | ||||||
| Impairment | 33 | 25 | 0.04 | ||||||
| Adjusted net earnings | $ | 118 | $ | 0.20 | |||||
Management’s Discussion and Analysis
The following management’s discussion and analysis (MD&A) is the
responsibility of management and dated as of May 9, 2019. The Board of
Directors (Board) of Nutrien carries out its responsibility for review
of this disclosure principally through its audit committee, comprised
exclusively of independent directors. The audit committee reviews and,
prior to its publication approves this disclosure pursuant to the
authority delegated to it by the Board. The term “Nutrien” refers to
Nutrien Ltd. and the terms “we,” “us,” “our,” “Nutrien” and “the
Company” refer to Nutrien and, as applicable, Nutrien and its direct and
indirect subsidiaries as a group. Additional information relating to
Nutrien (which, except as otherwise noted, is not incorporated by
reference herein), including our 2018 Annual Report dated February 20,
2019, which includes our consolidated financial statements and
management’s discussion and analysis and our Annual Information Form,
each for the year ended December 31, 2018, can be found on SEDAR at www.sedar.com
and on EDGAR at www.sec.gov.
The Company is a foreign private issuer under the rules and regulations
of the US Securities and Exchange Commission (the SEC).
This MD&A is based on the Company’s unaudited interim condensed
consolidated financial statements as at and for the three months ended
March 31, 2019 (interim financial statements) prepared in accordance
with International Financial Reporting Standards as issued by the
International Accounting Standards Board (IFRS) and prepared in
accordance with International Accounting Standard 34 “Interim Financial
Reporting” unless otherwise stated. It contains certain non-IFRS
financial measures and forward-looking statements which are described in
the “Non-IFRS Financial Measures” section which begins on page 15 and
the “Forward-Looking Statements” section on page 12 respectively. For
the definitions of financial and non-financial terms used in this MD&A,
as well as a list of abbreviated company names and sources, see pages
87, 157 and 158 of our 2018 Annual Report. All references to per share
amounts pertain to diluted net earnings (loss) per share and all
financial data are stated in millions of US dollars unless otherwise
noted.
Market Outlook
Agriculture and Retail
-
Trade disruptions continue to impact North American growers. US
soybean exports to China are down 55 percent year-over-year, while
China has also placed import restrictions on two of Canada’s largest
canola exporters. -
Unfavorable weather in the US since the fourth quarter of 2018 has
narrowed the application window. However, the US Department of
Agriculture (USDA) projects corn plantings will reach nearly 93
million acres, which would be the highest since 2016 and favorable for
nutrient demand, seed expenditures and custom application services.
-
We expect a two to four percent increase in North American crop
protection expenditures in 2019 due to higher corn acreage and
increased weed pressure this year given the limited ability for
growers to use post-harvest applications last fall. -
Seed expenditures are also expected to be supported by increased corn
acreage in the US.
Crop Nutrient Markets
-
Global potash market fundamentals have remained strong, as suppliers
are comfortably sold forward in 2019 and Canpotex is fully committed
until June. We maintain our forecast that 2019 deliveries will be
between 67 and 69 million tonnes, underpinned by good affordability in
the US and most key offshore markets, particularly in Brazil and
China. While weak palm oil prices are a headwind for demand in
Southeast Asia, we believe the downside risks are relatively limited
as potash is applied on a wide range of crops in the region. -
We expect strong nitrogen demand to emerge in the second quarter of
2019 from the US, Europe and Latin America. In the US, we expect
overall nitrogen demand will be at historically strong levels in the
second and third quarter with some weather-related product mix shift
towards urea and UAN as opposed to ammonia. In recent weeks, this has
led to NOLA urea prices increasing by almost $50 per tonne from
February lows. -
Slow global demand and lower input costs pressured phosphate prices
over the past quarter, although we expect some support from an
improvement in demand in Latin America, India and the US in the second
quarter.
Financial Outlook and Guidance
Based on the market factors detailed above, we are maintaining 2019
adjusted net earnings guidance of $2.80 to $3.20 per share and adjusted
EBITDA guidance of $4.4 billion to $4.9 billion. First-half 2019
guidance is provided at $1.75 to $1.95 adjusted net earnings per share.
As the 2019 guidance has not changed, all related assumptions and
sensitivities can be found on page 62 of Nutrien’s 2018 Annual Report.
All guidance numbers, including those noted above, are outlined in the
table below:
| 2019 Guidance Ranges 1 | Low | High | |||||||
| Adjusted net earnings per share 2 | $ | 2.80 | $ | 3.20 | |||||
| Adjusted first-half net earnings per share 2 | $ |
1.75 |
$ |
1.95 |
|||||
| Adjusted EBITDA (billions) 2 | $ | 4.40 | $ | 4.90 | |||||
| Retail EBITDA (billions) | $ | 1.30 | $ | 1.40 | |||||
| Potash EBITDA (billions) | $ | 1.80 | $ | 2.00 | |||||
| Nitrogen EBITDA (billions) | $ | 1.30 | $ | 1.50 | |||||
| Phosphate EBITDA (billions) | $ | 0.20 | $ | 0.30 | |||||
| Potash sales tonnes (millions) 3 | 13.0 | 13.4 | |||||||
| Nitrogen sales tonnes (millions) 3 | 10.6 | 11.0 | |||||||
| Depreciation and amortization (billions) | $ | 1.80 | $ | 1.90 | |||||
| Merger and related costs (millions) | $ | 50 | $ | 75 | |||||
| Effective tax rate on continuing operations | 24 | % | 26 | % | |||||
| Sustaining capital expenditures (billions) | $ | 1.00 | $ | 1.10 | |||||
1 See Forward-Looking Statements section starting on page 12.
2
See Non-IFRS Financial Measures section starting on page 15.
3
Manufactured products only. Nitrogen excludes ESN® and Rainbow products.
Consolidated Results
| Three months ended March 31 | |||||||||||
|
(millions of US dollars) |
2019 | 2018 | % Change | ||||||||
| Sales 1 | $ | 3,691 | $ | 3,666 | 1 | ||||||
| Freight, transportation and distribution | (171 | ) | (208 | ) | (18 | ) | |||||
| Cost of goods sold 1 | (2,545 | ) | (2,611 | ) | (3 | ) | |||||
| Gross margin | 975 | 847 | 15 | ||||||||
| Expenses | (799 | ) | (771 | ) | 4 | ||||||
| Net earnings (loss) | 41 | (1 | ) | n/m | |||||||
| EBITDA 2 | 596 | 487 | 22 | ||||||||
| Adjusted EBITDA 2 | 697 | 569 | 22 | ||||||||
1 Certain immaterial figures have been reclassified or grouped
together for the three months ended March 31, 2018.
2
See Non-IFRS Financial Measures section starting on page 15.
n/m
= Not meaningful
-
Nutrien’s first-quarter net earnings were up from the loss in the
first quarter of 2018, supported by higher global nutrient prices,
strong operational results and the continued benefit of synergy
realization. Partially offsetting this was lower overall sales volumes
of nutrients and lower Retail earnings related to the extremely wet
weather in the US and dry conditions in Australia.
Segment Results
In the first quarter of 2019, our Executive Leadership Team reassessed
our product groupings and decided to evaluate the performance of
ammonium sulfate as part of the Nitrogen segment, rather than the
Phosphate and Sulfate segment as reported in 2018. Effective January 1,
2019, we have four reportable operating segments: Retail, Potash,
Nitrogen and Phosphate. Comparative amounts presented on a segmented
basis have been restated accordingly. We also renamed our “Others”
segment to “Corporate and Others”.
Detailed descriptions of our operating segments can be found in our 2018
Annual Report on pages 32-35 (Retail), 39-41 (Potash), 45-47 (Nitrogen)
and 51-53 (Phosphate).
Our discussion of segment results set out on the following pages is a
comparison of our first quarter 2019 results to our first quarter 2018
results unless otherwise noted.
Retail
| Three months ended March 31 | |||||||||||||||||||||||||||||
| Dollars (millions) | Gross Margin Dollars (millions) | Gross Margin (%) | |||||||||||||||||||||||||||
| 2019 | 2018 | % Change | 2019 | 2018 | % Change | 2019 | 2018 | ||||||||||||||||||||||
| Sales | |||||||||||||||||||||||||||||
| Crop nutrients 1 | $ | 687 | $ | 684 | – | $ | 131 | $ | 123 | 7 | 19 | 18 | |||||||||||||||||
| Crop protection products | 744 | 774 | (4 | ) | 117 | 128 | (9 | ) | 16 | 17 | |||||||||||||||||||
| Seed | 356 | 341 | 4 | 50 | 44 | 14 | 14 | 13 | |||||||||||||||||||||
| Merchandise 2 | 108 | 120 | (10 | ) | 19 | 23 | (17 | ) | 18 | 19 | |||||||||||||||||||
| Services and other | 144 | 151 | (5 | ) | 92 | 90 | 2 | 64 | 60 | ||||||||||||||||||||
| 2,039 | 2,070 | (1 | ) | $ | 409 | $ | 408 | – | 20 | 20 | |||||||||||||||||||
| Cost of goods sold 2 | (1,630 | ) | (1,662 | ) | (2 | ) | |||||||||||||||||||||||
| Gross margin | 409 | 408 | – | ||||||||||||||||||||||||||
| Expenses 3 | (571 | ) | (541 | ) | 6 | ||||||||||||||||||||||||
|
Earnings before finance
costs and taxes (EBIT) |
(162 | ) | (133 | ) | 22 | ||||||||||||||||||||||||
| Depreciation and amortization | 136 | 123 | 11 | ||||||||||||||||||||||||||
| EBITDA | $ | (26 | ) | $ | (10 | ) | 160 | ||||||||||||||||||||||
1 Includes intersegment sales. See Note 2 to the interim financial
statements.
2 Certain immaterial figures have been
reclassified or grouped together for the three months ended March 31,
2018.
3 Includes selling expenses of $532 million (2018
– $523 million).
-
Retail EBITDA was lower as planting and applications were
delayed by extreme wet weather across the US and dryness in Australia.
Sales of crop protection, crop nutrients and associated application
services were most notably affected; however, higher crop nutrient
prices and margins helped partly offset the effects of the postponed
applications. Total gross margin percentage remained flat compared to
the same period last year. -
Crop nutrients sales were flat as higher sales prices were
offset by lower sales volumes. Gross margin increased primarily
because of higher selling prices. -
Crop protection products sales were lower as adverse US and
Australian weather impacted herbicide applications. Gross margin
percentage decreased due to a combination of higher competition
related to elevated inventories, and higher costs of raw materials
sourced from China. -
Seed sales and gross margin percentage increased slightly
compared to the same quarter in 2018 as US growers look to plant
higher corn acreage than soybeans in 2019. Proprietary seed gross
margins are up across all geographies resulting in favorable product
mix and improved overall gross margin. -
Merchandise sales declined as a result of lower equipment sales
in the Canadian operations to focus more on core Retail products. -
Services and other sales were down due to lower livestock
export shipments and wool commissions in Australia and the delayed
start to the spring application season across the US. The sales mix
change resulted in a higher gross margin percentage compared to the
same period in 2018.
Potash
| Three months ended March 31 | ||||||||||||||||||||||||||||||||
| Dollars (millions) | Tonnes (thousands) | Average per Tonne | ||||||||||||||||||||||||||||||
| 2019 | 2018 |
%
Change |
2019 | 2018 |
%
Change |
2019 | 2018 |
%
Change |
||||||||||||||||||||||||
| Manufactured product 1 | ||||||||||||||||||||||||||||||||
| Net sales | ||||||||||||||||||||||||||||||||
| North America | $ | 245 | $ | 250 | (2 | ) | 976 | 1,254 | (22 | ) | $ | 250 | $ | 199 | 26 | |||||||||||||||||
| Offshore | 451 | 324 | 39 | 1,944 | 1,871 | 4 | 232 | 173 | 34 | |||||||||||||||||||||||
| 696 | 574 | 21 | 2,920 | 3,125 | (7 | ) | 238 | 184 | 29 | |||||||||||||||||||||||
| Cost of goods sold | (272 | ) | (279 | ) | (3 | ) | (93 | ) | (90 | ) | 3 | |||||||||||||||||||||
| Gross margin | 424 | 295 | 44 | 145 | 94 | 54 | ||||||||||||||||||||||||||
| Other 2 | 1 | – | – | Depreciation and amortization | 34 | 29 | 17 | |||||||||||||||||||||||||
| Gross margin | 425 | 295 | 44 | Gross margin excluding | ||||||||||||||||||||||||||||
| Expenses 3 | (64 | ) | (58 | ) | 10 | depreciation and amortization 4 | 179 | 123 | 46 | |||||||||||||||||||||||
| EBIT | 361 | 237 | 52 | Cash cost of product | ||||||||||||||||||||||||||||
| Depreciation and amortization | 100 | 91 | 10 | manufactured 4 | 58 | 61 | (5 | ) | ||||||||||||||||||||||||
| EBITDA | $ | 461 | $ | 328 | 41 | |||||||||||||||||||||||||||
1 Includes intersegment sales. See Note 2 to the interim financial
statements.
2 Includes other potash and purchased
products and is comprised of net sales of $1 million (2018 – $1 million)
less cost of goods sold of $Nil (2018 – $1 million).
3
Includes provincial mining and other taxes of $63 million (2018 – $48
million).
4 See Non-IFRS Financial Measures section
starting on page 15.
-
EBITDA increased significantly due to a combination of higher
global potash prices and strong offshore sales volumes, partially
offset by lower domestic demand related to extremely wet weather in
the US which impacted fertilizer applications both this spring and
last fall. -
Sales volumes were down as strong demand in offshore markets
only partially offset weather-related lower sales volumes in the US.
Canpotex Limited (Canpotex) shipped record volumes in the first
quarter of 2019 and recently announced that it is fully committed
until June 2019. North American potash deliveries were slow due to the
late start to the spring season compounded by high retail inventories
as a result of the short fall application season. -
Net realized selling price increased due to strong global
demand and tight supply. -
Cost of goods sold per tonne was slightly higher due to higher
depreciation and amortization. Cash cost of product manufactured was
$58 per tonne in the first quarter, down 5 percent from the same
quarter in 2018.
Canpotex Sales by Market
| Three months ended March 31 | ||||||||||
| (percentage of sales volumes) | 2019 | 2018 | % Change | |||||||
| Other Asian markets 1 | 33 | 29 | 14 | |||||||
| China | 30 | 32 | (6 | ) | ||||||
| Latin America | 19 | 21 | (10 | ) | ||||||
| India | 10 | 6 | 67 | |||||||
| Other markets | 8 | 12 | (33 | ) | ||||||
| 100 | 100 | |||||||||
1 All Asian markets except China and India.
Nitrogen
| Three months ended March 31 | ||||||||||||||||||||||||||||||||
| Dollars (millions) | Tonnes (thousands) | Average per Tonne | ||||||||||||||||||||||||||||||
| 2019 | 2018 1 |
%
Change |
2019 | 2018 1 |
%
Change |
2019 | 2018 1 |
% Change |
||||||||||||||||||||||||
| Manufactured product 2 | ||||||||||||||||||||||||||||||||
| Net sales | ||||||||||||||||||||||||||||||||
| Ammonia | $ | 162 | $ | 208 | (22 | ) | 644 | 744 | (13 | ) | $ | 252 | $ | 280 | (10 | ) | ||||||||||||||||
| Urea | 213 | 212 | – | 647 | 724 | (11 | ) | 330 | 294 | 12 | ||||||||||||||||||||||
|
Solutions, nitrates and
sulfates |
171 | 155 | 10 | 948 | 907 | 5 | 180 | 170 | 6 | |||||||||||||||||||||||
| 546 | 575 | (5 | ) | 2,239 | 2,375 | (6 | ) | 244 | 242 | 1 | ||||||||||||||||||||||
| Cost of goods sold | (398 | ) | (438 | ) | (9 | ) | (178 | ) | (184 | ) | (3 | ) | ||||||||||||||||||||
| Gross margin | 148 | 137 | 8 | 66 | 58 | 14 | ||||||||||||||||||||||||||
| Other 3 | 18 | 16 | 13 | Depreciation and amortization | 50 | 56 | (11 | ) | ||||||||||||||||||||||||
| Gross margin | 166 | 153 | 8 | Gross margin excluding | ||||||||||||||||||||||||||||
| Expenses | (5 | ) | (16 | ) | (69 | ) | depreciation and amortization | 116 | 114 | 2 | ||||||||||||||||||||||
| EBIT | 161 | 137 | 18 | Urea controllable cash cost of | ||||||||||||||||||||||||||||
| Depreciation and amortization | 113 | 134 | (16 | ) | product manufactured 4 | 74 | 69 | 7 | ||||||||||||||||||||||||
| EBITDA | $ | 274 | $ | 271 | 1 | |||||||||||||||||||||||||||
1 Restated for the reclassification of sulfate from the Phosphate
segment. See page 4 of this document and Note 2 to the interim financial
statements.
2 Includes intersegment sales. See Note 2
to the interim financial statements.
3 Includes other
nitrogen (including ESN® and Rainbow) and purchased products and is
comprised of net sales of $131 million (2018 – $120 million) less cost
of goods sold of $113 million (2018 – $104 million).
4
See Non-IFRS Financial Measures section starting on page 15.
-
EBITDA increased slightly as a result of higher urea, UAN and
sulfate sales prices, primarily offset by lower nitrogen sales volumes
due to delayed applications in the US. -
Sales volumes for nitrogen decreased due to lower ammonia and
urea sales volumes, associated with wet weather in key US regions that
delayed nitrogen applications. -
Net realized selling price of nitrogen increased as higher
average prices for urea, UAN, and sulfates more than offset lower
prices for ammonia. Ammonia prices declined as a result of weak demand
for this product due to poor application conditions since the fourth
quarter of 2018, which provided support for alternative nitrogen
products such as urea. -
Cost of goods sold per tonne of nitrogen decreased overall due
to lower depreciation and amortization more than offsetting increased
costs from lower operating rates. As a result, urea controllable cash
cost of product manufactured increased by $5 per tonne.
Natural Gas Prices
| Three months ended March 31 | ||||||||||
| (Dollars per MMBtu) | 2019 | 2018 | % Change | |||||||
| Overall gas cost excluding realized derivative impact | $ | 2.98 | $ | 2.73 | 9 | |||||
| Realized derivative impact | 0.05 | 0.29 | (83 | ) | ||||||
| Overall gas cost | $ | 3.03 | $ | 3.02 | – | |||||
| Average NYMEX | $ | 3.15 | $ | 3.00 | 5 | |||||
| Average AECO | 1.47 | 1.48 | (1 | ) | ||||||
-
Gas costs were similar to the same quarter in 2018 as lower
realized derivative losses offset higher gas prices in Trinidad and
the US.
Phosphate
| Three months ended March 31 | ||||||||||||||||||||||||||||||||
| Dollars (millions) | Tonnes (thousands) | Average per Tonne | ||||||||||||||||||||||||||||||
| 2019 | 2018 1 |
% Change |
2019 | 2018 1 |
%
Change |
2019 | 2018 1 |
%
Change |
||||||||||||||||||||||||
| Manufactured product 2 | ||||||||||||||||||||||||||||||||
| Net sales | ||||||||||||||||||||||||||||||||
| Fertilizer | $ | 208 | $ | 240 | (13 | ) | 491 | 605 | (19 | ) | $ | 423 | $ | 396 | 7 | |||||||||||||||||
| Industrial and feed | 111 | 106 | 5 | 204 | 221 | (8 | ) | 545 | 481 | 13 | ||||||||||||||||||||||
| 319 | 346 | (8 | ) | 695 | 826 | (16 | ) | 459 | 419 | 10 | ||||||||||||||||||||||
| Cost of goods sold | (304 | ) | (322 | ) | (6 | ) | (437 | ) | (390 | ) | 12 | |||||||||||||||||||||
| Gross margin | 15 | 24 | (38 | ) | 22 | 29 | (24 | ) | ||||||||||||||||||||||||
| Other 3 | (1 | ) | – | – | Depreciation and amortization | 86 | 56 | 54 | ||||||||||||||||||||||||
| Gross margin | 14 | 24 | (42 | ) | Gross margin excluding | |||||||||||||||||||||||||||
| Expenses | (6 | ) | (6 | ) | – | depreciation and amortization | 108 | 85 | 27 | |||||||||||||||||||||||
| EBIT | 8 | 18 | (56 | ) | ||||||||||||||||||||||||||||
| Depreciation and amortization | 60 | 46 | 30 | |||||||||||||||||||||||||||||
| EBITDA | $ | 68 | $ | 64 | 6 | |||||||||||||||||||||||||||
1 Restated for the reclassification of sulfate to the Nitrogen
segment. See page 4 of this document and Note 2 to the interim financial
statements.
2 Includes intersegment sales. See Note 2 to
the interim financial statements.
3 Includes other
phosphate and purchased products and is comprised of net sales of $30
million (2018 – $35 million) less cost of goods sold of $31 million
(2018 – $35 million)
-
EBITDA increased due to higher realized prices. This was
partially offset by the impact of higher cost of goods sold per tonne. -
Sales volumes decreased as wet weather in the US delayed the
application season and lower demand from India impacted export volumes. -
Net realized selling price increased for the majority of our
phosphate products, even though phosphate benchmark prices declined.
This is due to first quarter presold phosphate sales at higher
benchmark prices and the settlement of new industrial contracts. -
Cost of goods sold per tonne increased due to higher
depreciation and amortization in 2019 and because the first quarter of
2018 benefited from asset retirement obligation adjustments.
Expenses & Income Below Gross Margin
| Three months ended March 31 | |||||||||
| Dollars (millions), except percentage amounts | 2019 | 2018 | % Change | ||||||
| Selling expenses 1 | $ | (538 | ) | $ | (532 | ) | 1 | ||
| General and administrative expenses 2 | (95 | ) | (103 | ) | (8 | ) | |||
| Provincial mining and other taxes 3 | (65 | ) | (48 | ) | 35 | ||||
| Share-based compensation expenses | (57 | ) | (16 | ) | 256 | ||||
| Other expenses | (44 | ) | (72 | ) | (39 | ) | |||
| Finance costs | (123 | ) | (119 | ) | 3 | ||||
| Income tax (expense) recovery | (12 | ) | 42 | n/m | |||||
| Other comprehensive income (loss) | 32 | (70 | ) | n/m | |||||
1 Expenses are primarily in the Retail segment. See page 4 for
analysis.
2 Includes expenses of $64 million (2018 – $68
million) in the Corporate and Others segment.
3 Expenses
are primarily in the Potash segment. See page 5 for analysis.
n/m
= not meaningful
-
Share-based compensation expenses increased due to improved
performance towards vesting conditions and a higher Nutrien share
price. -
Other expenses decreased primarily due to lower costs
associated with the merger of Potash Corporation of Saskatchewan Inc.
and Agrium Inc. (Merger) more than offsetting the $33 million
impairment of our intangible assets as a result of Fertilizantes
Heringer S.A. filing for bankruptcy protection in the first quarter of
2019. -
Income tax (expense) recovery changed as we had earnings before
income taxes for the three months ended March 31, 2019 compared to a
loss before income taxes for the same period in 2018. In addition,
discrete tax adjustments increased tax expense by $15 million for the
three months ended March 31, 2019 compared to a discrete tax recovery
of $3 million for the same period in 2018. As a result, an income tax
expense was realized for the three months ended March 31, 2019 as
compared to an income tax recovery for the same period last year. -
Other comprehensive income (loss) was impacted primarily by
unrealized gains in our investment in Sinofert Holdings Limited
(Sinofert) compared to unrealized losses in Sinofert and a realized
loss in Israel Chemicals Ltd. (ICL) in the comparative quarter, as
well as a gain on translation of our operations in Canada and
Australia compared to a loss on translation of those operations in the
same period in 2018 due to decreases in the value of the Canadian
dollar and Australian dollar relative to the US dollar.
Financial Condition Review
The following balance sheet categories contained variances that were
considered significant:
| As at | ||||||||||||
| Assets |
March 31,
2019 |
December 31,
2018 |
$
Variance |
% Change |
||||||||
| Cash and cash equivalents | $ | 373 | $ | 2,314 | (1,941 | ) | (84 | ) | ||||
| Inventories | 6,560 | 4,917 | 1,643 | 33 | ||||||||
| Prepaid expenses and other current assets | 688 | 1,089 | (401 | ) | (37 | ) | ||||||
| Property, plant and equipment | 19,834 | 18,796 | 1,038 | 6 | ||||||||
| Goodwill | 11,817 | 11,431 | 386 | 3 | ||||||||
| Liabilities and Equity | ||||||||||||
| Short-term debt | $ | 1,652 | $ | 629 | 1,023 | 163 | ||||||
| Current portion of long-term debt | 1,197 | 1,003 | 194 | 19 | ||||||||
| Payables and accrued charges | 6,602 | 6,703 | (101 | ) | (2 | ) | ||||||
| Long-term debt | 7,917 | 7,591 | 326 | 4 | ||||||||
| Share capital | 16,316 | 16,740 | (424 | ) | (3 | ) | ||||||
| Retained earnings | 7,405 | 7,745 | (340 | ) | (4 | ) | ||||||
Contacts
Investor and Media Relations:
Richard Downey
Vice
President, Investor & Corporate Relations
(403) 225-7357
Investors@nutrien.com
Investor Relations:
Jeff Holzman
Senior Director,
Investor Relations
(306) 933-8545
Todd Coakwell
Director, Investor Relations
(403) 225-7437
Contact us at: www.nutrien.com
Selected financial data for download can be found in our data tool at https://www.nutrien.com/interactive-datatool
Such
data is not incorporated by reference herein.


Warning: Undefined array key 0 in /home/grassnews/public_html/wp-content/themes/zox-news/parts/post-single.php on line 493
Warning: Attempt to read property "cat_ID" on null in /home/grassnews/public_html/wp-content/themes/zox-news/parts/post-single.php on line 493
Innocan
Innocan Pharma Submits Investigational New Animal Drug Application to FDA’s Veterinary Center

HERZLIYA, Israel and CALGARY, AB, July 26, 2024 /PRNewswire/ — Innocan Pharma Corporation (CSE: INNO) (FSE: IP4) (OTCQB: INNPF) (“Innocan” or the “Company”), a pioneer in the pharmaceutical and biotechnology industries, is pleased to announce that the FDA’s Center for Veterinary Medicine (CVM) has granted the Company a sponsor fee waiver and assigned an Investigational New Animal Drug (INAD) number for its LPT-CBD (Liposome Platform Technology-Cannabidiol) product. This represents a significant step for the Company, as an INAD designation facilitates correspondence and data exchange with CVM to support LPT-CBD development as a new veterinary drug.
The Company further announced that following the assessment of LPT-CBD’s scientific package, the CVM recognized Innocan’s contribution to pursuing innovative animal drug products and technology and granted the company a sponsor fee waiver for fiscal year 2024.
Innocan’s LPT-CBD is a proprietary drug delivery platform designed to provide prolonged-release CBD for chronic pain and well-being management in animals. Over the past year, repeated administration of LPT-CBD in dogs and other animals has demonstrated both efficacy and tolerability, providing sufficient evidence for the INAD application.
“We are thrilled by CVM’s response,” said Prof. Chezy Barenholz, CSO of Innocan Pharma. “The granted INAD will allow us to advance the investigational studies of LPT-CBD and share knowledge to support future discussions with CVM on LPT-CBD’s development plan. Moreover, the fee waiver, granted by CVM, supports our development and pursuit of innovative animal drug products and technology, further validating our approach and potential impact in veterinary medicine.”
Dr. Eyal Kalo, R&D Director at Innocan, added, “LPT-CBD is a unique technology that has proven itself worthy of the INAD fee waiver granted by CVM. This will streamline our efforts to deliver a unique solution for chronic pain management to the animal market.”
About Innocan Pharma:
Innocan is a pharmaceutical tech company that operates under two main segments: Pharmaceuticals and Consumer Wellness. In the Pharmaceuticals segment, Innocan focuses on developing innovative drug delivery platform technologies comprises with cannabinoids science, to treat various conditions to improve patients’ quality of life. This segment involves two drug delivery technologies: (i) LPT CBD-loaded liposome platform facilitating exact dosing and the prolonged and controlled release of CBD into the blood stream. The LPT delivery platform research is in the preclinical trial phase for two indications: Epilepsy and Pain Management. In the Consumer Wellness segment, Innocan develops and markets a wide portfolio of innovative and high-performance self-care products to promote a healthier lifestyle. Under this segment Innocan has established a Joint Venture by the name of BI Sky Global Ltd. that focuses developing on advanced targeted online sales. https://innocanpharma.com/
Contact Information:
For Innocan Pharma Corporation:
Iris Bincovich, CEO
+1 5162104025
+972-54-3012842
+442037699377
info@innocanpharma.com
NEITHER THE CANADIAN SECURITIES EXCHANGE NOR ITS REGULATION SERVICES PROVIDER HAVE REVIEWED OR ACCEPT RESPONSIBILITY FOR THE ADEQUACY OR ACCURACY OF THIS RELEASE.
Caution Regarding Forward-Looking Information
Certain information set forth in this news release, including, without limitation, the Company’s plans for human trials of its LPT-CBD platform, is forward-looking information within the meaning of applicable securities laws. By its nature, forward-looking information is subject to numerous risks and uncertainties, some of which are beyond Innocan’s control. . The forward-looking information contained in this news release is based on certain key expectations and assumptions made by Innocan, including expectations and assumptions concerning the anticipated benefits of the products, satisfaction of regulatory requirements in various jurisdictions and satisfactory completion of production and distribution arrangements.
Forward-looking information is subject to various risks and uncertainties that could cause actual results and experience to differ materially from the anticipated results or expectations expressed in this news release. The key risks and uncertainties include but are not limited to: global and local (national) economic, political, market and business conditions; governmental and regulatory requirements and actions by governmental authorities; and potential disruption of relationships with suppliers, manufacturers, customers, business partners and competitors. There are also risks that are inherent in the nature of product distribution, including import/export matters and the failure to obtain any required regulatory and other approvals (or to do so in a timely manner). The anticipated timeline for entry to markets may change for a number of reasons, including the inability to secure necessary regulatory requirements, or the need for additional time to conclude and/or satisfy the manufacturing and distribution arrangements. As a result of the foregoing, readers should not place undue reliance on the forward-looking information contained in this news release. A comprehensive discussion of other risks that impact Innocan can be found in Innocan’s public reports and filings which are available under Innocan’s profile at www.sedarplus.ca.
Readers are cautioned that undue reliance should not be placed on forward-looking information as actual results may vary materially from the forward-looking information. Innocan does not undertake to update, correct or revise any forward-looking information as a result of any new information, future events or otherwise, except as may be required by applicable law.
Logo: https://mma.prnewswire.com/media/2046271/3968398/Innocan_Pharma_Corporation_Logo.jpg
![]() View original content:https://www.prnewswire.co.uk/news-releases/innocan-pharma-submits-investigational-new-animal-drug-application-to-fdas-veterinary-center-302207435.html
View original content:https://www.prnewswire.co.uk/news-releases/innocan-pharma-submits-investigational-new-animal-drug-application-to-fdas-veterinary-center-302207435.html

Cannabis
Verano Announces the Opening of Zen Leaf Fairless Hills, the Company’s Newest Affiliated Dispensary in Pennsylvania, in Prime New Location
- Zen Leaf Fairless Hills, the Company’s newest affiliated dispensary in Pennsylvania, relocated from its former home in Chester to 203 Lincoln Highway, a busy thoroughfare with daily traffic of over 17,000 vehicles per day1
- As the first medical cannabis dispensary in the city, Zen Leaf Fairless Hills will offer an elevated experience for area patients, including increased convenience and accessibility with numerous point-of-sale stations and kiosks for seamless in-store browsing and ordering
- Verano’s active operations span 13 states, comprised of 142 dispensaries and 13 cultivation and processing facilities with more than 1 million square feet of cultivation capacity
CHICAGO, July 26, 2024 (GLOBE NEWSWIRE) — Verano Holdings Corp. (Cboe CA: VRNO) (OTCQX: VRNOF) (“Verano” or the “Company”), a leading multi-state cannabis company, today announced the opening of Zen Leaf Fairless Hills in Pennsylvania on Friday, July 26th, following a ceremonial ribbon cutting at 11 a.m. local time. Zen Leaf Fairless Hills is located at 203 Lincoln Highway and will be open Monday through Saturday from 9 a.m. to 8 p.m. and Sunday from 10 a.m. to 6 p.m. local time.
The dispensary is located in Bucks County, the fourth largest county in the Commonwealth with a total population of over 630,0002 residents. To increase accessibility and convenience, Zen Leaf Fairless Hills features large in-store kiosks and numerous point-of-sale stations to enhance the browsing and ordering experience for patients. To celebrate the grand opening of Zen Leaf Fairless Hills and following a ceremonial ribbon cutting, patients will be greeted with complimentary deals and doorbusters on featured branded products.
“We are excited to bring the Zen Leaf experience to local patients in Fairless Hills, where our talented team members will continue to deliver hospitality-driven care and top-quality products for local patients,” said George Archos, Verano Founder and Chief Executive Officer. “As the Pennsylvania medical cannabis patient population continues to grow, we are grateful for the opportunity to deepen our roots in Bucks County at our newest Zen Leaf location in the Commonwealth, and look forward to providing a warm and welcoming environment for current and future patients.”
Zen Leaf Fairless Hills adds another convenient outlet for Philadelphia area patients, and solidifies Verano’s footprint in the state as one of the Company’s 18 affiliated Pennsylvania dispensaries. Verano’s Pennsylvania operations also include a state-of-the-art 62,000 square foot cultivation and processing facility in Chester, where the Company produces its signature Verano Reserve flower and Troches, concentrates and vapes; (the) Essence and Savvy flower and extracts; and Avexia RSO cannabis oil and topicals. For additional convenience and accessibility, patients can choose to order ahead at ZenLeafDispensaries.com for express in-store pickup.
About Verano
Verano Holdings Corp. (Cboe CA: VRNO) (OTCQX: VRNOF), one of the U.S. cannabis industry’s leading companies based on historical revenue, geographic scope and brand performance, is a vertically integrated, multi-state operator embracing a mission of saying Yes to plant progress and the bold exploration of cannabis. Verano provides a superior cannabis shopping experience in medical and adult use markets under the Zen Leaf™ and MÜV™ dispensary banners, including Cabbage Club™, an innovative annual membership program offering exclusive benefits for cannabis consumers. Verano produces a comprehensive suite of high-quality, regulated cannabis products sold under its diverse portfolio of trusted consumer brands including Verano™, (the) Essence™, MÜV™, Savvy™, BITS™, Encore™, and Avexia™. Verano’s active operations span 13 U.S. states, comprised of 13 production facilities with over 1,000,000 square feet of cultivation capacity. Learn more at Verano.com.
Contacts:
Media
Verano
Steve Mazeika
VP, Communications
Steve.Mazeika@verano.com
Investors
Verano
Julianna Paterra, CFA
VP, Investor Relations
Julianna.Paterra@verano.com
Forward Looking Statements
This press release contains “forward-looking statements” within the meaning of the safe harbor provisions of the United States Private Securities Litigation Reform Act of 1995. Such forward-looking statements are not representative of historical facts or information or current condition, but instead represent only the Company’s beliefs regarding future events, plans, strategies, or objectives, many of which, by their nature, are inherently uncertain and outside of the Company’s control. Generally, such forward-looking statements can be identified by the use of forward-looking terminology such as “plans”, “expects” or “does not expect”, “is expected”, “budget”, “future”, “scheduled”, “estimates”, “forecasts”, “projects,” “intends”, “anticipates” or “does not anticipate”, or “believes”, or variations of such words and phrases, or may contain statements that certain actions, events or results “may”, “could”, “would”, “might” or “will be taken”, “will continue”, “will occur” or “will be achieved”. Forward-looking statements involve and are subject to assumptions and known and unknown risks, uncertainties, and other factors which may cause actual events, results, performance, or achievements of the Company to be materially different from future events, results, performance, and achievements expressed or implied by forward-looking statements herein, including, without limitation, the risk factors described in the Company’s annual report on Form 10-K for the year ended December 31, 2023, its quarterly report on Form 10-Q for the quarter ended March 31, 2024 and any subsequent quarterly reports on Form 10-Q, in each case, filed with the U.S. Securities and Exchange Commission at www.sec.gov. The Company makes no assurances and cannot predict the outcome of all or any part of the on-going litigation with Goodness Growth referenced in this press release, including whether the Company will prevail on its Notice of Application and its counterclaim, or whether Goodness Growth will prevail on its claim for damages against the Company. The forward-looking statements contained in this press release are made as of the date of this press release, and the Company does not undertake to update any forward-looking information or forward-looking statements that are contained or referenced herein, except as may be required in accordance with applicable securities laws. All subsequent written and oral forward-looking information and statements attributable to the Company or persons acting on its behalf is expressly qualified in its entirety by this notice regarding forward-looking information and statements.
###
1 Pennsylvania Department of Transportation
2 United States Census Bureau

Cannabis
Unlocking New Horizons in Health: TNR, The Niche Research Reveals the Transformative Power of Minor Cannabinoids
Wilmington, Delaware, July 25, 2024 (GLOBE NEWSWIRE) — Minor cannabinoids refer to the lesser-known compounds found in the cannabis plant, distinct from the well-known THC (tetrahydrocannabinol) and CBD (cannabidiol). While THC and CBD dominate the market, minor cannabinoids such as CBG (cannabigerol), CBC (cannabichromene), and CBN (cannabinol) are gaining attention for their potential therapeutic benefits. These compounds are extracted from both marijuana and hemp plants, with varying legal restrictions depending on their THC content. The minor cannabinoids market is poised for significant growth, driven by increasing consumer awareness and demand for alternative health and wellness products. As regulatory environments around cannabis products evolve, companies are exploring the potential of minor cannabinoids in various applications, including pharmaceuticals, nutraceuticals, cosmetics, and food and beverages.
Minor cannabinoids are being researched for their potential therapeutic effects, including anti-inflammatory, analgesic, and neuroprotective properties. This versatility facilitates product diversification in various industries. Companies are investing in research and development to create novel formulations and delivery methods for minor cannabinoids. This includes nano-emulsions, encapsulation technologies, and controlled-release systems to enhance bioavailability and efficacy. For example, in January 2022, CBDA + CBGA Tincture a new product was launched by Hometown Hero CBD. This 30ml tincture contains 600mg each of CBGA, CBDA, CBG, and CBD. Derived from hemp, the cannabinoids in this tincture comply with legal requirements across all 50 states in the USA. There is an increasing consumer preference for natural as well as plant-based remedies, which in turn is driving the demand for cannabinoid-infused products. This trend is particularly strong among younger demographics seeking alternatives to traditional pharmaceuticals. Evolving regulatory frameworks, particularly in regions like North America and Europe, are creating opportunities for legal market expansion. Regulatory clarity is crucial for market participants to navigate compliance and market entry.
Global Minor Cannabinoids Market: Key Datapoints
|
Market Value in 2023 |
US$ 17.8 Bn |
|
Market Value Forecast by 2034 |
US$ 42.3 Bn |
|
Growth Rate
|
8.2% |
|
Historical Data
|
2016 – 2022 |
|
Base Year
|
2023 |
|
Forecast Data
|
2024 – 2034 |
Increasing consumer interest in health and wellness products, coupled with the perceived therapeutic benefits of cannabinoids, is a major driver of market growth. Progressive cannabis legalization in various parts of the world, including the United States and parts of Europe, is expanding the addressable market for minor cannabinoids. Significant investments in research and development by pharmaceutical and biotechnology companies are accelerating product innovation and clinical trials. The market remains fragmented with opportunities for new entrants and niche players to introduce specialized products catering to specific consumer needs.
The COVID-19 pandemic initially disrupted supply chains and retail channels for minor cannabinoids products. However, the crisis also underscored the importance of health and wellness, leading to increased interest in natural remedies, including cannabinoids. As economies recover, the market is expected to rebound stronger.
The geopolitical tensions, such as the Russia-Ukraine conflict, have also affected global markets, including the minor cannabinoids sector. Fluctuating currency values, supply chain disruptions, and geopolitical uncertainty have impacted production and distribution channels. However, the long-term impact will depend on geopolitical developments and their influence on global trade and regulatory environments.
The minor cannabinoids market presents significant opportunities for growth and innovation, driven by evolving consumer preferences, regulatory advancements, and expanding research initiatives. Companies that can navigate regulatory complexities, invest in research and development, and respond to shifting consumer trends are well-positioned to capitalize on this emerging market. As the market matures, collaboration across sectors and regions will be crucial in unlocking the full potential of minor cannabinoids in various industries worldwide.
Global Minor Cannabinoids Market: Key Takeaways of the Report
- Cannabigerol (CBG) segment by product type is expected to grow at a CAGR of 6.7% in the minor cannabinoids market due to increasing research highlighting its potential therapeutic benefits, including anti-inflammatory, antimicrobial, and neuroprotective properties. As consumer awareness grows and regulatory environments become more favorable, there is heightened interest in CBG-based products for their diverse health applications, ranging from skincare to pharmaceutical formulations, driving sustained market demand and expansion.
- Pharmaceutical segment by application, leads the minor cannabinoids market with a significant revenue share of 35.8% owing to growing recognition of cannabinoids’ potential in therapeutic applications. Cannabinoids like CBD, CBG, and others show promise in treating conditions such as epilepsy, chronic pain, and anxiety disorders, backed by increasing clinical research and favorable regulatory developments. Pharmaceutical companies are investing heavily in cannabinoid-based drug development, driving market growth as they seek to capitalize on these compounds’ efficacy and market potential in addressing unmet medical needs.
- In 2023, Latin America is anticipated as fastest growing region in the global minor cannabinoids market due to evolving regulatory landscapes favoring cannabis legalization and cultivation. This shift is fostering a burgeoning industry infrastructure for cannabis extraction and product development. Additionally, increasing consumer acceptance of cannabinoid-based products for medicinal and wellness purposes is driving market expansion. With a vast potential consumer base and supportive regulatory frameworks, Latin America presents significant growth opportunities for companies seeking to enter or expand within the minor cannabinoids market.
Key Development:
- In December 2023, Rare Cannabinoid Company introduced Uplift Gummies infused with THC and THCV. These gummies combine the relaxing properties of Delta-9-THC with the energizing and appetite-controlling effects of CBD and THCV.
- In October 2022, High Tide Inc., a cannabis retailer, announced that its Colorado-based subsidiary, NuLeaf Naturals, had launched plant-based softgels and full-spectrum multicannabinoid oil in Manitoba. The products feature CBC, CBD, CBG, Delta-9 tetrahydrocannabinol (Delta 9), and CBN.
Browse Related Category Reports
Global Minor Cannabinoids Market:
- Aurora Europe GmbH
- BulKanna
- CBD. INC.
- Fresh Bros Hemp Company
- GCM Holdings, LLC (Global Cannabinoids)
- GenCanna.
- High Purity Natural Products.
- Laurelcrest
- Mile High Labs
- PBG Global
- Rhizo Sciences
- ZERO POINT EXTRACTION, LLC
- Other Industry Participants
Global Minor Cannabinoids Market
By Product Type
- Cannabigerol (CBG)
- Cannabichromene (CBC)
- Cannabinol (CBN)
- Cannabidivarin (CBDV)
- Tetrahydrocannabutol (THCB)
- Tetrahydrocannabivarin (THCV)
- Tetrahydrocannabiphorol (THCP)
- Others
By Application
- Pharmaceutical
- Pain Management
- Mental Health
- Sleep Disorders
- Anti-inflammatory
- Others
- Nutraceuticals
- Cosmetics and Personal Care
- Food and Beverages
- Others
By Region
- North America (U.S., Canada, Mexico, Rest of North America)
- Europe (France, The UK, Spain, Germany, Italy, Nordic Countries (Denmark, Finland, Iceland, Sweden, Norway), Benelux Union (Belgium, The Netherlands, Luxembourg), Rest of Europe)
- Asia Pacific (China, Japan, India, New Zealand, Australia, South Korea, Southeast Asia (Indonesia, Thailand, Malaysia, Singapore, Rest of Southeast Asia), Rest of Asia Pacific)
- Middle East & Africa (Saudi Arabia, UAE, Egypt, Kuwait, South Africa, Rest of Middle East & Africa)
- Latin America (Brazil, Argentina, Rest of Latin America)
Consult with Our Expert:
Jay Reynolds
The Niche Research
Japan (Toll-Free): +81 663-386-8111
South Korea (Toll-Free): +82-808- 703-126
Saudi Arabia (Toll-Free): +966 800-850-1643
United Kingdom: +44 753-710-5080
United States: +1 302-232-5106
Email: askanexpert@thenicheresearch.com
Website: www.thenicheresearch.com
![]()

-

 Cannabis2 weeks ago
IM Cannabis Shares Commence Trading on 6:1 Consolidated Basis
-
 Cannabis2 weeks ago
Fractional Flow Reserve Market growing at a CAGR of 15.56% during the forecast period [2024-2030] – Exactitude Consultancy
-
 Cannabis1 week ago
Blank Rome Bolsters Energy Industry Team in Houston and Pittsburgh with Leading Transactional Group
-

 Cannabis1 week ago
Manitoba Harvest Hemp Foods and Brightseed® Introduce New Coffee and Chocolate Flavors in Organic Bioactive Fiber Supplement for Gut Health
-
 Cannabis5 days ago
Europe Medical Cannabis Oil Market Set to Reach Valuation of USD 2,395.83 Million by 2032 | Astute Analytica
-
 Cannabis4 days ago
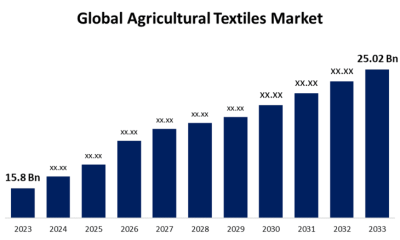
Global Agricultural Textiles Market Size To Worth USD 25.02 Billion By 2033 | CAGR of 4.70%
-
 Cannabis2 days ago
Unlocking New Horizons in Health: TNR, The Niche Research Reveals the Transformative Power of Minor Cannabinoids
-
Cannabis17 hours ago
Verano Announces the Opening of Zen Leaf Fairless Hills, the Company’s Newest Affiliated Dispensary in Pennsylvania, in Prime New Location