
/home/grassnews/public_html/wp-content/themes/zox-news/parts/post-single.php on line 153
">
Warning: Undefined array key 0 in /home/grassnews/public_html/wp-content/themes/zox-news/parts/post-single.php on line 153
Warning: Attempt to read property "cat_name" on null in /home/grassnews/public_html/wp-content/themes/zox-news/parts/post-single.php on line 153
Ubiquiti Networks Reports Third Quarter Fiscal 2019 Financial Results
~ Revenues of $284.9 million~
NEW YORK–(BUSINESS WIRE)–Ubiquiti Networks, Inc. (NASDAQ: UBNT) (“Ubiquiti” or the “Company”)
today announced results for the third quarter fiscal 2019, ended
March 31, 2019.
Third Quarter Fiscal 2019 Financial Highlights
- Revenues of $284.9 million, increasing 13.8% year-over-year
- GAAP net income of $88.3 million and GAAP diluted EPS of $1.25
-
Non-GAAP net income of $88.9 million and non-GAAP diluted EPS of
$1.26, increasing 28.6% year-over-year
Additional Highlights
-
The Company repurchased and retired 91,249 shares of common stock for
$9.0 million at an average price of $98.63 per share during the third
quarter fiscal 2019. -
The Company has $178.2 million of availability remaining under the
$200 million share repurchase program announced on November 9, 2018. -
The Company’s Board of Directors declared a $0.25 per share cash
dividend payable on May 28, 2019 to shareholders of record at the
close of business on May 20, 2019.
|
Financial Highlights ($, in millions, except per share data) |
|||||||||
| Income statement highlights | F3Q19 | F2Q19 | F3Q18 | ||||||
| Revenues | 284.9 | 307.3 | 250.4 | ||||||
| Service Provider Technology | 109.4 | 113.2 | 100.9 | ||||||
| Enterprise Technology | 175.5 | 194.1 | 149.5 | ||||||
| Gross profit | 132.8 | 140.2 | 114.5 | ||||||
| Gross Profit (%) | 46.6 | % | 45.6 | % | 45.7 | % | |||
| Total Operating Expenses | 30.7 | 48.6 | 29.6 | ||||||
| Income from Operations | 102.1 | 91.7 | 84.9 | ||||||
| GAAP Net Income | 88.3 | 77.8 | 102.7 | ||||||
| GAAP EPS (diluted) | 1.25 | 1.09 | 1.32 | ||||||
| Non-GAAP Net Income | 88.9 | 95.1 | 76.0 | ||||||
| Non-GAAP EPS (diluted) | 1.26 | 1.33 | 0.98 | ||||||
|
Ubiquiti Networks, Inc.  |
||||||||||||
| Three Months Ended March 31, | Nine Months Ended March 31, | |||||||||||
| 2019 | 2018 | 2019 | 2018 | |||||||||
| Service Provider Technology | $ | 109,379 | $ | 100,892 | $ | 327,558 | $ | 340,659 | ||||
| Enterprise Technology | 175,532 | 149,512 | 547,534 | 406,424 | ||||||||
| Total revenues | $ | 284,911 | $ | 250,404 | $ | 875,092 | $ | 747,083 | ||||
|
Ubiquiti Networks, Inc. Revenues by Geographical Area (In thousands) (Unaudited) |
||||||||||||
| Three Months Ended March 31, | Nine Months Ended March 31, | |||||||||||
| 2019 | 2018 | 2019 | 2018 | |||||||||
| North America | $ | 109,135 | $ | 94,800 | $ | 349,740 | $ | 285,927 | ||||
| South America | 22,976 | 19,882 | 58,059 | 71,681 | ||||||||
| Europe, the Middle East and Africa | 125,662 | 113,738 | 384,985 | 309,078 | ||||||||
| Asia Pacific | 27,138 | 21,984 | 82,308 | 80,397 | ||||||||
| Total revenues | $ | 284,911 | $ | 250,404 | $ | 875,092 | $ | 747,083 | ||||
Income Statement Items
Revenues
Revenues for the third quarter fiscal 2019 were $284.9 million,
representing a decrease from the prior quarter of 7.3% and an increase
from the comparable prior year period of 13.8%. Revenues for the first
nine months of fiscal 2019 were $875.1 million, representing an increase
of 17.1% from the first nine months of fiscal 2018.
We believe the sequential decline in revenues for the third quarter
fiscal 2019 is primarily due to distributor ordering patterns and as
described in the “Outlook” section below, we expect to achieve revenues
for the fiscal year ending June 30, 2019 at the high end of the guidance
range previously provided.
Gross Margins
During the third quarter fiscal 2019, GAAP gross profit was $132.8
million. GAAP gross margin of 46.6% increased 0.9% versus the comparable
prior year period GAAP gross margin of 45.7% and increased 1.0% versus
the prior quarter GAAP gross margin of 45.6%.
The increase in gross margin as a percentage of revenue for the third
quarter fiscal 2019 as compared to the comparable prior year period was
driven by the mix of products sold and offset, in part, by higher
indirect expenses. The increase in gross margin as a percentage of
revenue for the third quarter fiscal 2019 as compared to the second
quarter fiscal 2019 was driven by the mix of products sold and lower
indirect expenses.
We expect to incur costs as a result of tariffs on certain products
imported into the U.S. from China. However, we anticipate mitigating the
effect of the tariffs in the long-term and therefore our long-term gross
margins are expected to remain between 45% to 50%
Research and Development
During the third quarter fiscal 2019, research and development (R&D)
expenses were $21.3 million. This reflects an increase as compared to
the R&D expenses of $17.4 million in the comparable prior year period
and R&D expense of $20.0 million in the prior quarter.
Increased costs in third quarter fiscal 2019 as compared to both the
prior year period and prior quarter is primarily driven by higher
employee-related expenses. R&D expenses represented 7.5% of revenues in
the third quarter fiscal 2019, which is in line with the Company’s
target model range of 6% to 8%.
Sales, General and Administrative
The Company’s sales, general and administrative (“SG&A”) expenses for
the third quarter fiscal 2019 were $9.4 million. This reflects a
decrease as compared to the SG&A expenses of $12.2 million in the
comparable prior year period and SG&A expenses of $10.6 million in the
prior quarter. The decrease in SG&A costs as compared to the prior year
period was primarily related to lower professional fees and lower
employer payroll taxes associated with tax withholding related to
settlement of equity awards recorded in the third quarter fiscal 2018.
The decrease in SG&A costs as compared to the prior quarter was
primarily related to lower professional fees.
SG&A expenses represented 3.3% of revenues in the third quarter fiscal
2019, which is in line with the Company’s target model range of 3% to 5%.
Taxes
The GAAP effective tax rate was 11.4% for the nine months ended
March 31, 2019. For long-term planning purposes, we assume a target
effective tax rate of 11% to 14%.
Net Income and Earnings Per Share
During the third quarter fiscal 2019, GAAP net income was $88.3 million
and non-GAAP net income was $88.9 million. This reflects an increase in
non-GAAP net income from the comparable prior year period by 16.9%,
primarily driven by a 13.8% increase in revenues and a higher gross
margin.
During the third quarter fiscal 2019, GAAP earnings per diluted share
were $1.25 and non-GAAP earnings per diluted share were $1.26. This
reflects an increase in non-GAAP earnings per diluted share from the
comparable prior year period by 28.6%, primarily driven by higher
non-GAAP net income and a reduction in non-GAAP diluted shares
outstanding.
Balance Sheet Items
Cash and Investments
Total cash and cash equivalents were $310.3 million as of March 31, 2019
compared with $666.7 million as of June 30, 2018. In addition, as of
March 31, 2019, we held $102.0 million in available-for-sale securities.
During the third quarter fiscal 2019, the Company repurchased 91,249
shares of common stock for $9.0 million at an average price of $98.63
per share.
DSOs
This quarter the Company experienced a decline in days sales outstanding
(DSOs) in accounts receivable of 51 days, as compared with 52 days in
the second quarter fiscal 2019.
Inventory
Finished goods inventory as of March 31, 2019 was $276.7 million,
representing an increase of $25.0 million from December 31, 2018 and an
increase of $180.0 million from June 30, 2018. Finished goods inventory
increased during both periods due to increased production of inventory
to satisfy expected demand for our products. We expect to manage our
finished goods inventory to meet demand, reduce lead times and secure
supply.
Cash Flow Statement Items
The Company’s net cash flow from operations for the nine months ended
March 31, 2019 was $158.3 million, compared with a net cash flow from
operations of $285.1 million for the comparable prior year period. The
$126.9 million decrease in operating cash flow for the nine months ended
March 31, 2019 as compared with the comparable prior year period was
primarily driven by the net impact of increased inventory and the
corresponding payables, partially offset by higher net income. For the
nine months ended March 31, 2019, the Company used $400.7 million of
cash for financing activities, which was driven by $328.1 million in
stock repurchases and $53.8 million in cash dividend payments.
Outlook
Based on recent business trends, the Company expects to achieve results
at the high end of the guidance range previously provided for the full
fiscal year ending June 30, 2019.
About Ubiquiti Networks
Ubiquiti Networks is focused on democratizing network technology on a
global scale — aggregate shipments of nearly 85 million devices play a
key role in creating networking infrastructure in over 200 countries and
territories around the world. Our professional networking products are
powered by our UNMS and UniFi software platforms to provide
high-capacity distributed Internet access and unified information
technology management, respectively.
Ubiquiti and the U logo are trademarks or registered trademarks of
Ubiquiti and/or its affiliates in the United States and other countries.
For more information, please visit www.ui.com.
Safe Harbor for Forward Looking Statements
Certain statements in this press release are forward-looking statements
within the meaning of Section 27A of the Securities Act of 1933, as
amended, and Section 21E of the Securities Exchange Act of 1934, as
amended. Statements other than statements of historical fact including
words such as “look”, “will”, “anticipate”, “believe”, “estimate”,
“expect”, “forecast”, “consider” and “plan” and statements in the future
tense are forward looking statements. The statements in this press
release that could be deemed forward-looking statements include
statements regarding expectations for financial results for the full
fiscal year 2019, and statements regarding expectations of the impact of
tariffs, expected impact of taxes on our liquidity and results of
operations, our cash position, expenses, DSOs, number of distributors
and resellers, shipments, the introduction of new consumer products,
Gross Margins, R&D, SG&A, tax rates, inventory turns, growth
opportunities, demand and long term global environment for our products,
new products, and financial performance estimates including revenues and
GAAP diluted EPS for the Company’s full fiscal year 2019, and any
statements or assumptions underlying any of the foregoing.
Forward-looking statements are subject to certain risks and
uncertainties that could cause our actual future results to differ
materially or cause a material adverse impact on our results. Potential
risks and uncertainties include, but are not limited to, the impact of
U.S. tariffs on results, fluctuations in our operating results; varying
demand for our products due to the financial and operating condition of
our distributors and their customers, and distributors’ inventory
management practices; political and economic conditions and volatility
affecting the stability of business environments, economic growth,
currency values, commodity prices and other factors that may influence
the ultimate demand for our products in particular geographies or
globally; impact of counterfeiting and our ability to contain such
impact; our reliance on a limited number of distributors; inability of
our contract manufacturers and suppliers to meet our demand; our
dependence on Qualcomm Atheros for chipsets without a short-term
alternative; as we move into new markets competition from certain of our
current or potential competitors who may be more established in such
markets; our ability to keep pace with technological and market
developments; success and timing of new product introductions by us and
the performance of our products generally; our ability to effectively
manage the significant increase in our transactional sales volumes; we
may become subject to warranty claims, product liability and product
recalls; that a substantial majority of our sales are into countries
outside the United States and we are subject to numerous U.S. export
control and economic sanctions laws; costs related to responding to
government inquiries related to regulatory compliance; our reliance on
the Ubiquiti Community; our reliance on certain key members of our
management team, including our founder and chief executive officer,
Robert J. Pera; adverse tax-related matters such as tax audits, changes
in our effective tax rate or new tax legislative proposals; whether the
final determination of our income tax liability may be materially
different from our income tax provisions; the impact of any intellectual
property litigation and claims for indemnification; litigation related
to U.S. Securities laws; and economic and political conditions in the
United States and abroad. We discuss these risks in greater detail under
the heading “Risk Factors” and elsewhere in our Annual Report on Form
10-K for the year ended June 30, 2018, and subsequent filings filed with
the U.S. Securities and Exchange Commission (the “SEC”), which are
available at the SEC’s website at www.sec.gov.
Copies may also be obtained by contacting the Ubiquiti Networks Investor
Relations Department, by email at IR@ubnt.com
or by visiting the Investor Relations section of the Ubiquiti Networks
website, http://ir.ui.com.
Given these uncertainties, you should not place undue reliance on these
forward-looking statements. Also, forward-looking statements represent
our management’s beliefs and assumptions only as of the date made.
Except as required by law, Ubiquiti Networks undertakes no obligation to
update information contained herein. You should review our SEC filings
carefully and with the understanding that our actual future results may
be materially different from what we expect.
|
Ubiquiti Networks, Inc. |
||||||||||||||||
| Three Months Ended March 31, | Nine Months Ended March 31, | |||||||||||||||
|
|
2019 | 2018 | 2019 | 2018 | ||||||||||||
| Revenues | $ | 284,911 | $ | 250,404 | $ | 875,092 | $ | 747,083 | ||||||||
| Cost of revenues | 152,081 | 135,928 | 470,425 | 424,052 | ||||||||||||
| Gross profit | $ | 132,830 | $ | 114,476 | $ | 404,667 | $ | 323,031 | ||||||||
| Operating expenses: | ||||||||||||||||
| Research and development | 21,341 | 17,420 | 59,540 | 54,816 | ||||||||||||
| Sales, general and administrative | 9,352 | 12,186 | 33,715 | 30,203 | ||||||||||||
| Litigation settlement | — | — | 18,000 | — | ||||||||||||
| Total operating expenses | 30,693 | 29,606 | 111,255 | 85,019 | ||||||||||||
| Income from operations | 102,137 | 84,870 | 293,412 | 238,012 | ||||||||||||
| Interest expense and other, net | (3,447 | ) | (4,681 | ) | (9,186 | ) | (8,534 | ) | ||||||||
| Income before income taxes | 98,690 | 80,189 | 284,226 | 229,478 | ||||||||||||
| Income tax expense (benefit) | 10,390 | (22,550 | ) | 32,427 | 103,274 | |||||||||||
| Net income | $ | 88,300 | $ | 102,739 | $ | 251,799 | $ | 126,204 | ||||||||
| Net income per share of common stock: | ||||||||||||||||
| Basic | $ | 1.25 | $ | 1.34 | $ | 3.50 | $ | 1.61 | ||||||||
| Diluted | $ | 1.25 | $ | 1.32 | $ | 3.50 | $ | 1.58 | ||||||||
|
Weighted average shares used in computing |
||||||||||||||||
| Basic | 70,540 | 76,782 | 71,856 | 78,200 | ||||||||||||
| Diluted | 70,692 | 77,953 | 72,036 | 79,661 | ||||||||||||
| Other comprehensive income: | ||||||||||||||||
|
Unrealized gains on available-for-sale |
325 | — | 177 | — | ||||||||||||
| Comprehensive income | $ | 88,625 | $ | 102,739 | $ | 251,976 | $ | 126,204 | ||||||||
|
Ubiquiti Networks, Inc. Reconciliation of GAAP Net Income to Non-GAAP Net Income (In thousands, except per share data) (Unaudited) |
||||||||||||||||||||
| Three Months Ended | Nine Months Ended March 31, | |||||||||||||||||||
|
March 31, 2019 |
December 31, |
March 31, 2018 |
2019 | 2018 | ||||||||||||||||
| Net Income | $ | 88,300 | $ | 77,796 | $ | 102,739 | $ | 251,799 | $ | 126,204 | ||||||||||
| Stock-based compensation: | ||||||||||||||||||||
| Cost of revenues | 26 | 261 | 39 | 320 | 324 | |||||||||||||||
| Research and development | 555 | 497 | 527 | 1,519 | 1,353 | |||||||||||||||
| Sales, general and administrative | 171 | 21 | 166 | 467 | 747 | |||||||||||||||
|
Net Tax Benefits related to Equity Awards |
— | — | (27,419 | ) | — | (28,188 | ) | |||||||||||||
| Tax Reform Transition Tax | — | 2,765 | — | 2,765 | 112,798 | |||||||||||||||
| Litigation settlement | — | 18,000 | — | 18,000 | — | |||||||||||||||
| SEC Related matters | — | — | 317 | — | 317 | |||||||||||||||
| Tax effect of Non-GAAP adjustments | (177 | ) | (4,200 | ) | (325 | ) | (4,617 | ) | (932 | ) | ||||||||||
| Non-GAAP net income | $ | 88,875 | $ | 95,140 | $ | 76,044 | $ | 270,253 | $ | 212,623 | ||||||||||
| Non-GAAP diluted EPS | $ | 1.26 | $ | 1.33 | $ | 0.98 | $ | 3.75 | $ | 2.68 | ||||||||||
| Shares outstanding (Diluted) | 70,692 | 71,406 | 77,953 | 72,036 | 79,661 | |||||||||||||||
| Share adjustment (ASU 2016-09 Adoption) | — | — | (346 | ) | — | (433 | ) | |||||||||||||
|
Weighted-average shares used in Non-GAAP |
70,692 | 71,406 | 77,607 | 72,036 | 79,228 | |||||||||||||||
Use of Non-GAAP Financial Information
To supplement our condensed consolidated financial results prepared
under generally accepted accounting principles, or GAAP, we use non-GAAP
measures of net income and earnings per diluted share that are adjusted
to exclude certain costs, expenses and gains such as stock-based
compensation expense, net tax benefits related to equity awards
exercises and vesting, unusual litigation settlements, SEC related
matters, Tax Reform Transition Tax and the tax effects of these non-GAAP
adjustments.
Reconciliations of the adjustments to GAAP results for the periods
presented are provided above. In addition, an explanation of the ways in
which management uses non-GAAP financial information to evaluate its
business, the substance behind management’s decision to use this
non-GAAP financial information, material limitations associated with the
use of non-GAAP financial information, the manner in which management
compensates for those limitations, and the substantive reasons
management believes that this non-GAAP financial information provides
useful information to investors is included under the paragraphs below.
A reconciliation of non-GAAP guidance measures to corresponding GAAP
measures is not available on a forward-looking basis due to the high
variability and low visibility with respect to the charges which are
excluded from these non-GAAP measures. For example, share-based
compensation expense is impacted by the Company’s future price at which
the Company’s stock will trade in those future periods. The items that
are being excluded are difficult to predict and a reconciliation could
result in disclosure that would be imprecise or potentially misleading.
Material changes to any one of these items could have a significant
effect on our guidance and future GAAP results. Certain exclusions, such
as share-based compensation expenses, are generally incurred each
quarter, but the amounts have historically and may continue to vary
significantly from quarter to quarter.
Usefulness of Non-GAAP Financial Information to
Investors
We believe that the presentation of non-GAAP net income and non-GAAP
earnings per diluted share provides important supplemental information
regarding non-cash expenses, significant items that we believe are
important to understanding our financial, and business trends relating
to our financial condition and results of operations. Non-GAAP net
income and non-GAAP earnings per diluted share are among the primary
indicators used by management as a basis for planning and forecasting
future periods and by management and our board of directors to determine
whether our operating performance has met specified targets and
thresholds. Management uses non-GAAP net income and non-GAAP earnings
per diluted share when evaluating operating performance because it
believes that the exclusion of the items described below, for which the
amounts or timing may vary significantly depending upon the Company’s
activities and other factors, facilitates comparability of the Company’s
operating performance from period to period. We have chosen to provide
this information to investors so they can analyze our operating results
in the same way that management does and use this information in their
assessment of our business and the valuation of our Company.
About our Non-GAAP Net Income and Non-GAAP
Earnings per Diluted Share
We compute non-GAAP net income and non-GAAP earnings per diluted share
by adjusting GAAP net income and GAAP earnings per diluted share to
remove the impact of certain adjustments and the tax effect of those
adjustments. Items excluded from net income are:
- Stock-based compensation expense
- Net Tax Benefits related to Equity Awards Exercises and Vesting
- Litigation settlement
- Tax Reform Transition Tax
- SEC Related matters
- Tax effect of non-GAAP adjustments, applying the principles of ASC 740
These non-GAAP measures are not in accordance with, or an alternative
to, GAAP and may be materially different from other non-GAAP measures,
including similarly titled non-GAAP measures used by other companies.
The presentation of this additional information should not be considered
in isolation from, as a substitute for, or superior to, net income or
earnings per diluted share prepared in accordance with GAAP. Non-GAAP
financial measures have limitations in that they do not reflect certain
items that may have a material impact upon our reported financial
results.
For more information on the non-GAAP adjustments, please see the table
captioned “Reconciliation of GAAP Net Income to Non-GAAP Net Income”
included in this press release.
|
Ubiquiti Networks, Inc. Condensed Consolidated Balance Sheets (In thousands, except share amounts) (Unaudited) |
||||||
| March 31, 2019 | June 30, 2018 (1) | |||||
| Assets | ||||||
| Current assets: | ||||||
| Cash and cash equivalents | $ | 310,264 | $ | 666,681 | ||
| Investments — short-term | 61,325 | — | ||||
| Accounts receivable, net | 159,867 | 174,521 | ||||
| Inventories | 279,924 | 102,220 | ||||
| Vendor deposits | 23,721 | 39,029 | ||||
| Prepaid income taxes | 3,533 | — | ||||
| Prepaid expenses and other current assets | 22,513 | 18,901 | ||||
| Total current assets | 861,147 | 1,001,352 | ||||
| Property and equipment, net | 13,412 | 14,328 | ||||
| Deferred tax assets — long-term | 3,106 | 3,106 | ||||
| Investments — long-term | 40,668 | — | ||||
| Other long-term assets | 12,216 | 3,791 | ||||
| Total assets | $ | 930,549 | $ | 1,022,577 | ||
| Liabilities and Stockholders’ Equity | ||||||
| Current liabilities: | ||||||
| Accounts payable | $ | 91,437 | $ | 14,098 | ||
| Income taxes payable | 14,751 | 5,780 | ||||
| Debt — short-term | 27,550 | 24,425 | ||||
| Other current liabilities | 37,331 | 68,613 | ||||
| Total current liabilities | 171,069 | 112,916 | ||||
| Income taxes payable — long-term | 123,034 | 127,719 | ||||
| Debt — long-term | 438,926 | 460,352 | ||||
| Other long-term liabilities | 9,420 | 5,842 | ||||
| Total liabilities | 742,449 | 706,829 | ||||
| Stockholders’ equity: | ||||||
| Common Stock | 71 | 74 | ||||
| Additional paid–in capital | 769 | 393 | ||||
| Accumulated other comprehensive income | 177 | — | ||||
| Retained earnings | 187,083 | 315,281 | ||||
| Total stockholders’ equity | 188,100 | 315,748 | ||||
| Total liabilities and stockholders’ equity | $ | 930,549 | $ | 1,022,577 | ||
(1) Derived from audited consolidated financial statements as of and
for the fiscal year ended June 30, 2018.
|
Ubiquiti Networks, Inc. Condensed Consolidated Cash Flows (In thousands) (Unaudited) |
||||||||
| Nine Months Ended March 31, | ||||||||
| 2019 | 2018 | |||||||
| Cash Flows from Operating Activities: | ||||||||
| Net income | $ | 251,799 | $ | 126,204 | ||||
|
Adjustments to reconcile net income to net cash provided by operating activities: |
||||||||
| Depreciation and amortization | 5,474 | 5,069 | ||||||
| Amortization of debt issuance costs | 836 | 473 | ||||||
| Premium amortization and (discount accretion), net | (555 | ) | — | |||||
| Write off unamortized debt issuance costs | — | 489 | ||||||
| Provision for inventory obsolescence | 2,995 | 2,447 | ||||||
| Provision/(recovery) for loss on vendor deposits | 2,333 | 15,050 | ||||||
| Stock-based compensation | 2,306 | 2,423 | ||||||
| Deferred Taxes | — | 2,300 | ||||||
| Other, net | (399 | ) | 148 | |||||
| Changes in operating assets and liabilities: | ||||||||
| Accounts receivable | 14,888 | (17,902 | ) | |||||
| Inventories | (180,749 | ) | 46,462 | |||||
| Vendor deposits | 16,170 | (4,076 | ) | |||||
| Prepaid income taxes | (3,533 | ) | (10,332 | ) | ||||
| Prepaid expenses and other assets | (4,576 | ) | (6,850 | ) | ||||
| Accounts payable | 77,362 | 23,012 | ||||||
| Income taxes payable | 4,286 | 102,293 | ||||||
| Deferred revenues | 8,687 | 1,531 | ||||||
| Accrued and other liabilities | (39,070 | ) | (3,632 | ) | ||||
| Net cash provided by operating activities | 158,254 | 285,109 | ||||||
| Cash Flows from Investing Activities: | ||||||||
| Purchase of property and equipment and other long-term assets | (7,701 | ) | (7,318 | ) | ||||
| Private equity investment | (5,000 | ) | — | |||||
| Purchase of investments | (200,791 | ) | — | |||||
| Proceeds from sale of investments | 69,670 | — | ||||||
| Proceeds from maturities of investments | 29,831 | — | ||||||
| Net cash (used in) investing activities | (113,991 | ) | (7,318 | ) | ||||
| Cash Flows from Financing Activities: | ||||||||
|
Proceeds from borrowing under the Second Amended & Restated Facility – Term |
— | 500,000 | ||||||
| Proceeds from borrowing under the Amended Credit Facility- Revolver | — | 218,500 | ||||||
| Repayment against Amended Credit Facility- Revolver | — | (399,500 | ) | |||||
| Repayment against Credit Facility | (18,750 | ) | (82,500 | ) | ||||
| Debt Issuance Costs | — | (5,186 | ) | |||||
| Repurchases of common stock | (328,078 | ) | (381,883 | ) | ||||
| Payment of common stock cash dividends | (53,770 | ) | — | |||||
| Proceeds from exercise of stock options | 810 | 1,118 | ||||||
| Tax withholdings related to net share settlements of stock options | — | (40,622 | ) | |||||
|
Tax withholdings related to net share settlements of restricted stock units |
(892 | ) | (1,110 | ) | ||||
| Net cash (used in) provided by financing activities | (400,680 | ) | (191,183 | ) | ||||
| Net (decrease) increase in cash and cash equivalents | (356,417 | ) | 86,608 | |||||
| Cash and cash equivalents at beginning of period | 666,681 | 604,198 | ||||||
| Cash and cash equivalents at end of period | $ | 310,264 | $ | 690,806 | ||||
| Supplemental Disclosure of Cash Flow Information: | ||||||||
| Income taxes paid, net of refunds | $ | 31,284 | $ | 18,944 | ||||
| Interest paid | $ | 18,228 | $ | 9,955 | ||||
| Non-Cash Investing and Financing Activities: | ||||||||
| Unpaid stock repurchases | $ | — | $ | 21,984 | ||||
| Unpaid property and equipment and other long-term assets | $ | 120 | $ | 180 | ||||
| Net unsettled investment purchases, sales and maturities | $ | (29 | ) | $ | — | |||
Contacts
Investor Relations
Laura Kiernan
High
Touch Investor Relations
laura.kiernan@ubnt.com
Ph.
1-914-598-7733


Warning: Undefined array key 0 in /home/grassnews/public_html/wp-content/themes/zox-news/parts/post-single.php on line 493
Warning: Attempt to read property "cat_ID" on null in /home/grassnews/public_html/wp-content/themes/zox-news/parts/post-single.php on line 493
Innocan
Innocan Pharma Submits Investigational New Animal Drug Application to FDA’s Veterinary Center

HERZLIYA, Israel and CALGARY, AB, July 26, 2024 /PRNewswire/ — Innocan Pharma Corporation (CSE: INNO) (FSE: IP4) (OTCQB: INNPF) (“Innocan” or the “Company”), a pioneer in the pharmaceutical and biotechnology industries, is pleased to announce that the FDA’s Center for Veterinary Medicine (CVM) has granted the Company a sponsor fee waiver and assigned an Investigational New Animal Drug (INAD) number for its LPT-CBD (Liposome Platform Technology-Cannabidiol) product. This represents a significant step for the Company, as an INAD designation facilitates correspondence and data exchange with CVM to support LPT-CBD development as a new veterinary drug.
The Company further announced that following the assessment of LPT-CBD’s scientific package, the CVM recognized Innocan’s contribution to pursuing innovative animal drug products and technology and granted the company a sponsor fee waiver for fiscal year 2024.
Innocan’s LPT-CBD is a proprietary drug delivery platform designed to provide prolonged-release CBD for chronic pain and well-being management in animals. Over the past year, repeated administration of LPT-CBD in dogs and other animals has demonstrated both efficacy and tolerability, providing sufficient evidence for the INAD application.
“We are thrilled by CVM’s response,” said Prof. Chezy Barenholz, CSO of Innocan Pharma. “The granted INAD will allow us to advance the investigational studies of LPT-CBD and share knowledge to support future discussions with CVM on LPT-CBD’s development plan. Moreover, the fee waiver, granted by CVM, supports our development and pursuit of innovative animal drug products and technology, further validating our approach and potential impact in veterinary medicine.”
Dr. Eyal Kalo, R&D Director at Innocan, added, “LPT-CBD is a unique technology that has proven itself worthy of the INAD fee waiver granted by CVM. This will streamline our efforts to deliver a unique solution for chronic pain management to the animal market.”
About Innocan Pharma:
Innocan is a pharmaceutical tech company that operates under two main segments: Pharmaceuticals and Consumer Wellness. In the Pharmaceuticals segment, Innocan focuses on developing innovative drug delivery platform technologies comprises with cannabinoids science, to treat various conditions to improve patients’ quality of life. This segment involves two drug delivery technologies: (i) LPT CBD-loaded liposome platform facilitating exact dosing and the prolonged and controlled release of CBD into the blood stream. The LPT delivery platform research is in the preclinical trial phase for two indications: Epilepsy and Pain Management. In the Consumer Wellness segment, Innocan develops and markets a wide portfolio of innovative and high-performance self-care products to promote a healthier lifestyle. Under this segment Innocan has established a Joint Venture by the name of BI Sky Global Ltd. that focuses developing on advanced targeted online sales. https://innocanpharma.com/
Contact Information:
For Innocan Pharma Corporation:
Iris Bincovich, CEO
+1 5162104025
+972-54-3012842
+442037699377
info@innocanpharma.com
NEITHER THE CANADIAN SECURITIES EXCHANGE NOR ITS REGULATION SERVICES PROVIDER HAVE REVIEWED OR ACCEPT RESPONSIBILITY FOR THE ADEQUACY OR ACCURACY OF THIS RELEASE.
Caution Regarding Forward-Looking Information
Certain information set forth in this news release, including, without limitation, the Company’s plans for human trials of its LPT-CBD platform, is forward-looking information within the meaning of applicable securities laws. By its nature, forward-looking information is subject to numerous risks and uncertainties, some of which are beyond Innocan’s control. . The forward-looking information contained in this news release is based on certain key expectations and assumptions made by Innocan, including expectations and assumptions concerning the anticipated benefits of the products, satisfaction of regulatory requirements in various jurisdictions and satisfactory completion of production and distribution arrangements.
Forward-looking information is subject to various risks and uncertainties that could cause actual results and experience to differ materially from the anticipated results or expectations expressed in this news release. The key risks and uncertainties include but are not limited to: global and local (national) economic, political, market and business conditions; governmental and regulatory requirements and actions by governmental authorities; and potential disruption of relationships with suppliers, manufacturers, customers, business partners and competitors. There are also risks that are inherent in the nature of product distribution, including import/export matters and the failure to obtain any required regulatory and other approvals (or to do so in a timely manner). The anticipated timeline for entry to markets may change for a number of reasons, including the inability to secure necessary regulatory requirements, or the need for additional time to conclude and/or satisfy the manufacturing and distribution arrangements. As a result of the foregoing, readers should not place undue reliance on the forward-looking information contained in this news release. A comprehensive discussion of other risks that impact Innocan can be found in Innocan’s public reports and filings which are available under Innocan’s profile at www.sedarplus.ca.
Readers are cautioned that undue reliance should not be placed on forward-looking information as actual results may vary materially from the forward-looking information. Innocan does not undertake to update, correct or revise any forward-looking information as a result of any new information, future events or otherwise, except as may be required by applicable law.
Logo: https://mma.prnewswire.com/media/2046271/3968398/Innocan_Pharma_Corporation_Logo.jpg
![]() View original content:https://www.prnewswire.co.uk/news-releases/innocan-pharma-submits-investigational-new-animal-drug-application-to-fdas-veterinary-center-302207435.html
View original content:https://www.prnewswire.co.uk/news-releases/innocan-pharma-submits-investigational-new-animal-drug-application-to-fdas-veterinary-center-302207435.html

Cannabis
Verano Announces the Opening of Zen Leaf Fairless Hills, the Company’s Newest Affiliated Dispensary in Pennsylvania, in Prime New Location
- Zen Leaf Fairless Hills, the Company’s newest affiliated dispensary in Pennsylvania, relocated from its former home in Chester to 203 Lincoln Highway, a busy thoroughfare with daily traffic of over 17,000 vehicles per day1
- As the first medical cannabis dispensary in the city, Zen Leaf Fairless Hills will offer an elevated experience for area patients, including increased convenience and accessibility with numerous point-of-sale stations and kiosks for seamless in-store browsing and ordering
- Verano’s active operations span 13 states, comprised of 142 dispensaries and 13 cultivation and processing facilities with more than 1 million square feet of cultivation capacity
CHICAGO, July 26, 2024 (GLOBE NEWSWIRE) — Verano Holdings Corp. (Cboe CA: VRNO) (OTCQX: VRNOF) (“Verano” or the “Company”), a leading multi-state cannabis company, today announced the opening of Zen Leaf Fairless Hills in Pennsylvania on Friday, July 26th, following a ceremonial ribbon cutting at 11 a.m. local time. Zen Leaf Fairless Hills is located at 203 Lincoln Highway and will be open Monday through Saturday from 9 a.m. to 8 p.m. and Sunday from 10 a.m. to 6 p.m. local time.
The dispensary is located in Bucks County, the fourth largest county in the Commonwealth with a total population of over 630,0002 residents. To increase accessibility and convenience, Zen Leaf Fairless Hills features large in-store kiosks and numerous point-of-sale stations to enhance the browsing and ordering experience for patients. To celebrate the grand opening of Zen Leaf Fairless Hills and following a ceremonial ribbon cutting, patients will be greeted with complimentary deals and doorbusters on featured branded products.
“We are excited to bring the Zen Leaf experience to local patients in Fairless Hills, where our talented team members will continue to deliver hospitality-driven care and top-quality products for local patients,” said George Archos, Verano Founder and Chief Executive Officer. “As the Pennsylvania medical cannabis patient population continues to grow, we are grateful for the opportunity to deepen our roots in Bucks County at our newest Zen Leaf location in the Commonwealth, and look forward to providing a warm and welcoming environment for current and future patients.”
Zen Leaf Fairless Hills adds another convenient outlet for Philadelphia area patients, and solidifies Verano’s footprint in the state as one of the Company’s 18 affiliated Pennsylvania dispensaries. Verano’s Pennsylvania operations also include a state-of-the-art 62,000 square foot cultivation and processing facility in Chester, where the Company produces its signature Verano Reserve flower and Troches, concentrates and vapes; (the) Essence and Savvy flower and extracts; and Avexia RSO cannabis oil and topicals. For additional convenience and accessibility, patients can choose to order ahead at ZenLeafDispensaries.com for express in-store pickup.
About Verano
Verano Holdings Corp. (Cboe CA: VRNO) (OTCQX: VRNOF), one of the U.S. cannabis industry’s leading companies based on historical revenue, geographic scope and brand performance, is a vertically integrated, multi-state operator embracing a mission of saying Yes to plant progress and the bold exploration of cannabis. Verano provides a superior cannabis shopping experience in medical and adult use markets under the Zen Leaf™ and MÜV™ dispensary banners, including Cabbage Club™, an innovative annual membership program offering exclusive benefits for cannabis consumers. Verano produces a comprehensive suite of high-quality, regulated cannabis products sold under its diverse portfolio of trusted consumer brands including Verano™, (the) Essence™, MÜV™, Savvy™, BITS™, Encore™, and Avexia™. Verano’s active operations span 13 U.S. states, comprised of 13 production facilities with over 1,000,000 square feet of cultivation capacity. Learn more at Verano.com.
Contacts:
Media
Verano
Steve Mazeika
VP, Communications
Steve.Mazeika@verano.com
Investors
Verano
Julianna Paterra, CFA
VP, Investor Relations
Julianna.Paterra@verano.com
Forward Looking Statements
This press release contains “forward-looking statements” within the meaning of the safe harbor provisions of the United States Private Securities Litigation Reform Act of 1995. Such forward-looking statements are not representative of historical facts or information or current condition, but instead represent only the Company’s beliefs regarding future events, plans, strategies, or objectives, many of which, by their nature, are inherently uncertain and outside of the Company’s control. Generally, such forward-looking statements can be identified by the use of forward-looking terminology such as “plans”, “expects” or “does not expect”, “is expected”, “budget”, “future”, “scheduled”, “estimates”, “forecasts”, “projects,” “intends”, “anticipates” or “does not anticipate”, or “believes”, or variations of such words and phrases, or may contain statements that certain actions, events or results “may”, “could”, “would”, “might” or “will be taken”, “will continue”, “will occur” or “will be achieved”. Forward-looking statements involve and are subject to assumptions and known and unknown risks, uncertainties, and other factors which may cause actual events, results, performance, or achievements of the Company to be materially different from future events, results, performance, and achievements expressed or implied by forward-looking statements herein, including, without limitation, the risk factors described in the Company’s annual report on Form 10-K for the year ended December 31, 2023, its quarterly report on Form 10-Q for the quarter ended March 31, 2024 and any subsequent quarterly reports on Form 10-Q, in each case, filed with the U.S. Securities and Exchange Commission at www.sec.gov. The Company makes no assurances and cannot predict the outcome of all or any part of the on-going litigation with Goodness Growth referenced in this press release, including whether the Company will prevail on its Notice of Application and its counterclaim, or whether Goodness Growth will prevail on its claim for damages against the Company. The forward-looking statements contained in this press release are made as of the date of this press release, and the Company does not undertake to update any forward-looking information or forward-looking statements that are contained or referenced herein, except as may be required in accordance with applicable securities laws. All subsequent written and oral forward-looking information and statements attributable to the Company or persons acting on its behalf is expressly qualified in its entirety by this notice regarding forward-looking information and statements.
###
1 Pennsylvania Department of Transportation
2 United States Census Bureau

Cannabis
Unlocking New Horizons in Health: TNR, The Niche Research Reveals the Transformative Power of Minor Cannabinoids
Wilmington, Delaware, July 25, 2024 (GLOBE NEWSWIRE) — Minor cannabinoids refer to the lesser-known compounds found in the cannabis plant, distinct from the well-known THC (tetrahydrocannabinol) and CBD (cannabidiol). While THC and CBD dominate the market, minor cannabinoids such as CBG (cannabigerol), CBC (cannabichromene), and CBN (cannabinol) are gaining attention for their potential therapeutic benefits. These compounds are extracted from both marijuana and hemp plants, with varying legal restrictions depending on their THC content. The minor cannabinoids market is poised for significant growth, driven by increasing consumer awareness and demand for alternative health and wellness products. As regulatory environments around cannabis products evolve, companies are exploring the potential of minor cannabinoids in various applications, including pharmaceuticals, nutraceuticals, cosmetics, and food and beverages.
Minor cannabinoids are being researched for their potential therapeutic effects, including anti-inflammatory, analgesic, and neuroprotective properties. This versatility facilitates product diversification in various industries. Companies are investing in research and development to create novel formulations and delivery methods for minor cannabinoids. This includes nano-emulsions, encapsulation technologies, and controlled-release systems to enhance bioavailability and efficacy. For example, in January 2022, CBDA + CBGA Tincture a new product was launched by Hometown Hero CBD. This 30ml tincture contains 600mg each of CBGA, CBDA, CBG, and CBD. Derived from hemp, the cannabinoids in this tincture comply with legal requirements across all 50 states in the USA. There is an increasing consumer preference for natural as well as plant-based remedies, which in turn is driving the demand for cannabinoid-infused products. This trend is particularly strong among younger demographics seeking alternatives to traditional pharmaceuticals. Evolving regulatory frameworks, particularly in regions like North America and Europe, are creating opportunities for legal market expansion. Regulatory clarity is crucial for market participants to navigate compliance and market entry.
Global Minor Cannabinoids Market: Key Datapoints
|
Market Value in 2023 |
US$ 17.8 Bn |
|
Market Value Forecast by 2034 |
US$ 42.3 Bn |
|
Growth Rate
|
8.2% |
|
Historical Data
|
2016 – 2022 |
|
Base Year
|
2023 |
|
Forecast Data
|
2024 – 2034 |
Increasing consumer interest in health and wellness products, coupled with the perceived therapeutic benefits of cannabinoids, is a major driver of market growth. Progressive cannabis legalization in various parts of the world, including the United States and parts of Europe, is expanding the addressable market for minor cannabinoids. Significant investments in research and development by pharmaceutical and biotechnology companies are accelerating product innovation and clinical trials. The market remains fragmented with opportunities for new entrants and niche players to introduce specialized products catering to specific consumer needs.
The COVID-19 pandemic initially disrupted supply chains and retail channels for minor cannabinoids products. However, the crisis also underscored the importance of health and wellness, leading to increased interest in natural remedies, including cannabinoids. As economies recover, the market is expected to rebound stronger.
The geopolitical tensions, such as the Russia-Ukraine conflict, have also affected global markets, including the minor cannabinoids sector. Fluctuating currency values, supply chain disruptions, and geopolitical uncertainty have impacted production and distribution channels. However, the long-term impact will depend on geopolitical developments and their influence on global trade and regulatory environments.
The minor cannabinoids market presents significant opportunities for growth and innovation, driven by evolving consumer preferences, regulatory advancements, and expanding research initiatives. Companies that can navigate regulatory complexities, invest in research and development, and respond to shifting consumer trends are well-positioned to capitalize on this emerging market. As the market matures, collaboration across sectors and regions will be crucial in unlocking the full potential of minor cannabinoids in various industries worldwide.
Global Minor Cannabinoids Market: Key Takeaways of the Report
- Cannabigerol (CBG) segment by product type is expected to grow at a CAGR of 6.7% in the minor cannabinoids market due to increasing research highlighting its potential therapeutic benefits, including anti-inflammatory, antimicrobial, and neuroprotective properties. As consumer awareness grows and regulatory environments become more favorable, there is heightened interest in CBG-based products for their diverse health applications, ranging from skincare to pharmaceutical formulations, driving sustained market demand and expansion.
- Pharmaceutical segment by application, leads the minor cannabinoids market with a significant revenue share of 35.8% owing to growing recognition of cannabinoids’ potential in therapeutic applications. Cannabinoids like CBD, CBG, and others show promise in treating conditions such as epilepsy, chronic pain, and anxiety disorders, backed by increasing clinical research and favorable regulatory developments. Pharmaceutical companies are investing heavily in cannabinoid-based drug development, driving market growth as they seek to capitalize on these compounds’ efficacy and market potential in addressing unmet medical needs.
- In 2023, Latin America is anticipated as fastest growing region in the global minor cannabinoids market due to evolving regulatory landscapes favoring cannabis legalization and cultivation. This shift is fostering a burgeoning industry infrastructure for cannabis extraction and product development. Additionally, increasing consumer acceptance of cannabinoid-based products for medicinal and wellness purposes is driving market expansion. With a vast potential consumer base and supportive regulatory frameworks, Latin America presents significant growth opportunities for companies seeking to enter or expand within the minor cannabinoids market.
Key Development:
- In December 2023, Rare Cannabinoid Company introduced Uplift Gummies infused with THC and THCV. These gummies combine the relaxing properties of Delta-9-THC with the energizing and appetite-controlling effects of CBD and THCV.
- In October 2022, High Tide Inc., a cannabis retailer, announced that its Colorado-based subsidiary, NuLeaf Naturals, had launched plant-based softgels and full-spectrum multicannabinoid oil in Manitoba. The products feature CBC, CBD, CBG, Delta-9 tetrahydrocannabinol (Delta 9), and CBN.
Browse Related Category Reports
Global Minor Cannabinoids Market:
- Aurora Europe GmbH
- BulKanna
- CBD. INC.
- Fresh Bros Hemp Company
- GCM Holdings, LLC (Global Cannabinoids)
- GenCanna.
- High Purity Natural Products.
- Laurelcrest
- Mile High Labs
- PBG Global
- Rhizo Sciences
- ZERO POINT EXTRACTION, LLC
- Other Industry Participants
Global Minor Cannabinoids Market
By Product Type
- Cannabigerol (CBG)
- Cannabichromene (CBC)
- Cannabinol (CBN)
- Cannabidivarin (CBDV)
- Tetrahydrocannabutol (THCB)
- Tetrahydrocannabivarin (THCV)
- Tetrahydrocannabiphorol (THCP)
- Others
By Application
- Pharmaceutical
- Pain Management
- Mental Health
- Sleep Disorders
- Anti-inflammatory
- Others
- Nutraceuticals
- Cosmetics and Personal Care
- Food and Beverages
- Others
By Region
- North America (U.S., Canada, Mexico, Rest of North America)
- Europe (France, The UK, Spain, Germany, Italy, Nordic Countries (Denmark, Finland, Iceland, Sweden, Norway), Benelux Union (Belgium, The Netherlands, Luxembourg), Rest of Europe)
- Asia Pacific (China, Japan, India, New Zealand, Australia, South Korea, Southeast Asia (Indonesia, Thailand, Malaysia, Singapore, Rest of Southeast Asia), Rest of Asia Pacific)
- Middle East & Africa (Saudi Arabia, UAE, Egypt, Kuwait, South Africa, Rest of Middle East & Africa)
- Latin America (Brazil, Argentina, Rest of Latin America)
Consult with Our Expert:
Jay Reynolds
The Niche Research
Japan (Toll-Free): +81 663-386-8111
South Korea (Toll-Free): +82-808- 703-126
Saudi Arabia (Toll-Free): +966 800-850-1643
United Kingdom: +44 753-710-5080
United States: +1 302-232-5106
Email: askanexpert@thenicheresearch.com
Website: www.thenicheresearch.com
![]()

-

 Cannabis2 weeks ago
IM Cannabis Shares Commence Trading on 6:1 Consolidated Basis
-
 Cannabis2 weeks ago
Fractional Flow Reserve Market growing at a CAGR of 15.56% during the forecast period [2024-2030] – Exactitude Consultancy
-
 Cannabis1 week ago
Blank Rome Bolsters Energy Industry Team in Houston and Pittsburgh with Leading Transactional Group
-

 Cannabis1 week ago
Manitoba Harvest Hemp Foods and Brightseed® Introduce New Coffee and Chocolate Flavors in Organic Bioactive Fiber Supplement for Gut Health
-
 Cannabis5 days ago
Europe Medical Cannabis Oil Market Set to Reach Valuation of USD 2,395.83 Million by 2032 | Astute Analytica
-
 Cannabis4 days ago
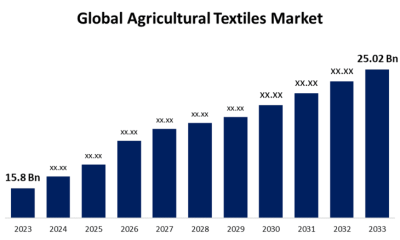
Global Agricultural Textiles Market Size To Worth USD 25.02 Billion By 2033 | CAGR of 4.70%
-
 Cannabis2 days ago
Unlocking New Horizons in Health: TNR, The Niche Research Reveals the Transformative Power of Minor Cannabinoids
-
Cannabis17 hours ago
Verano Announces the Opening of Zen Leaf Fairless Hills, the Company’s Newest Affiliated Dispensary in Pennsylvania, in Prime New Location