
Cannabis
Survey: Investors and Advisors Continue Move to Defensive Investments

After three consecutive financial quarters punctuated by market volatility, investors and advisors are taking a reserved approach to investing in Q4 2019, placing a greater emphasis on traditionally defensive asset classes like precious metals, according to the fourth-quarter 2019 Advisor and Investor Sentiment Surveys (“Q4 Surveys“) from Horizons ETFs Management (Canada) Inc. (“Horizons ETFs“).
Every quarter, Horizons ETFs surveys investment advisors and investors for their outlook on expected returns for 14 distinct asset classes. These expectations are expressed in terms of bullish, bearish or neutral sentiment. The Q4 Surveys cover the period beginning September 30, 2019, and ending December 31, 2019.
Canadian and U.S. Equities
With Canadian equity indices posting stronger average returns than U.S equities over Q3 2019, as represented by S&P 500® Index and the NASDAQ-100® Index, advisors are signaling growing confidence on investing in Canada.

Advisors registered a strong 8% increase on bullishness toward the S&P/TSX 60™ Index, as well as a 3% growth in bullishness on Canada’s banks, as represented by the S&P/TSX Capped Financials™ Index.
Investors similarly found greater confidence, increasing their optimism on the S&P/TSX Global Gold™ Index by 4% to an overall 60% bullishness weighting. However, both advisors and investors lost faith in Canadian energy, as represented by the S&P/TSX Capped Energy™ Index, amid a weak -2.15% performance in Q3 2019.
“While sentiment on Canadian equities has improved, Canadian advisors and investors are still skeptical of the growth of Canadian equities, particularly in comparison to U.S. equities,” said Steve Hawkins, President and CEO of Horizons ETFs. “The outcome of the upcoming federal election will likely weigh heavily on advisor sentiment and we could see substantial changes in sentiment next quarter depending on the outcome.”
Expectations south of the border have waned following tepid performances from the S&P 500 and NASDAQ-100, which posted returns of 1.70% and 1.29%, respectively, in Q3 2019. While still overall bullish, Advisors withdrew -8% from their overweight bullishness on the S&P 500 and -9% from the NASDAQ-100. Investors also cooled on the two major U.S. indices but by a marginal -1% on each.
“One of the U.S. equity stories of 2019 is the volatility that the ongoing trade war with China has wrought on performance,” said Mr. Hawkins. “Major gains – and losses – have been made possible on the back of a single tweet. Despite this, U.S. equities are on pace to finish the year with impressive double-digit returns, which likely explains why these stocks remain somewhat favorable with advisors despite the decline in sentiment.”
Defensive Assets Find Favour
Gold and silver, as represented by the spot prices of Gold Bullion and Silver Bullion, has continued a significant upward sentiment trend since Horizons ETFs’ Q1 2019 survey, conducted in December 2018.
In Q1 2019, advisors were 35% bullish on Gold Bullion, in near-equal weighting to the neutral and bearish sentiment shared. Since then, advisor preference for the precious metal has risen 23%, with silver following at a strong 17%.
On the investor side, confidence in gold and silver has been steady throughout 2019, with an outlook towards gold holding near or over 50% bullishness throughout the year. Silver has similarly held a bullish position with investors from Q1 to Q4 2019 among investors, concluding the year at 50% bullishness. Looking at Q4 2019, investors registered 60% bullishness on gold – their highest rating, alongside the S&P/TSX Global Gold™ Index.
“Amid the rise of cryptocurrencies and alternative investments, Gold is and will remain, a defensive standard for investors,” said Mr. Hawkins. “Its growth in popularity over 2019 is a reaction to a volatile marketplace and deflationary pressures, where investors are seeking a solid, tangible asset to provide some protection in their portfolio.”
After sentiment fell to outright bearish lows, outlook for fixed income, as represented by the Solactive US 7-10 Year Treasury Bond Index is growing following a 2.73% Q3 2019 performance. From a previous 16% bullishness, dwarfed by 48% bearishness on the asset class, advisors have increased their bullish confidence to 29% – putting it on equal standing as bearish skeptics. In contrast, investors have waned further, signaling a -5% pullback on an already bearish footing.
Natural Gas and Crude Oil
Investors and advisors both registered a bullish growth on natural gas in-line with the transition into its seasonally strong period. Advisors became bulls, awarding the commodity 10% greater confidence, while investors followed suit with a 9% increase in confidence. Futures on Natural Gas saw a modest uptick in performance at 0.95% during Q3 2019.
While still outright bullish, amid a -7.53% rout by Crude Oil, both advisors and investors withdrew some support for the fuel source. Investors withdrew by -4% while advisors retreated by -9%.
“Following the attacks on Saudi Arabia’s Aramco production facilities in September, there was some expectation that reduced supply would boost oil prices – but that wasn’t the case,” said Mr. Hawkins. “Greater U.S. domestic production and faster-than-expected repairs have meant crude oil has not been constrained, to the delight of those at the pump and the disappointment of some speculative oil traders.”
Marijuana Loses its Buzz
After hemorrhaging -36.07% in performance over Q3 2019, the cannabis sector, as represented by the North American Marijuana Index, registered the biggest confidence drop of the asset classes among investors, at -15%.
Despite the steep sentiment tumble, investors are still bullish on marijuana, with bulls edging out the bears at 43% to 39%. For investors, marijuana was also the least likely to have neutral sentiment provided, among the 14 asset classes measured.
Since the Q3 2019 survey, advisors have been overall bearish on the pot stocks index, with the trend continuing in to Q4 2019. Bearish sentiment increased 3% to 42%.
“While there are some that are decrying the ‘marijuana moment’ over, there is a silver lining to these significant sector declines, and that is valuations are now more aligned with fundamentals, establishing a more balanced entry point for investing in cannabis,” said Mr. Hawkins.
SOURCE Horizons ETFs Management (Canada) Inc.


Cannabis
Verano Announces the Opening of Zen Leaf Fairless Hills, the Company’s Newest Affiliated Dispensary in Pennsylvania, in Prime New Location
- Zen Leaf Fairless Hills, the Company’s newest affiliated dispensary in Pennsylvania, relocated from its former home in Chester to 203 Lincoln Highway, a busy thoroughfare with daily traffic of over 17,000 vehicles per day1
- As the first medical cannabis dispensary in the city, Zen Leaf Fairless Hills will offer an elevated experience for area patients, including increased convenience and accessibility with numerous point-of-sale stations and kiosks for seamless in-store browsing and ordering
- Verano’s active operations span 13 states, comprised of 142 dispensaries and 13 cultivation and processing facilities with more than 1 million square feet of cultivation capacity
CHICAGO, July 26, 2024 (GLOBE NEWSWIRE) — Verano Holdings Corp. (Cboe CA: VRNO) (OTCQX: VRNOF) (“Verano” or the “Company”), a leading multi-state cannabis company, today announced the opening of Zen Leaf Fairless Hills in Pennsylvania on Friday, July 26th, following a ceremonial ribbon cutting at 11 a.m. local time. Zen Leaf Fairless Hills is located at 203 Lincoln Highway and will be open Monday through Saturday from 9 a.m. to 8 p.m. and Sunday from 10 a.m. to 6 p.m. local time.
The dispensary is located in Bucks County, the fourth largest county in the Commonwealth with a total population of over 630,0002 residents. To increase accessibility and convenience, Zen Leaf Fairless Hills features large in-store kiosks and numerous point-of-sale stations to enhance the browsing and ordering experience for patients. To celebrate the grand opening of Zen Leaf Fairless Hills and following a ceremonial ribbon cutting, patients will be greeted with complimentary deals and doorbusters on featured branded products.
“We are excited to bring the Zen Leaf experience to local patients in Fairless Hills, where our talented team members will continue to deliver hospitality-driven care and top-quality products for local patients,” said George Archos, Verano Founder and Chief Executive Officer. “As the Pennsylvania medical cannabis patient population continues to grow, we are grateful for the opportunity to deepen our roots in Bucks County at our newest Zen Leaf location in the Commonwealth, and look forward to providing a warm and welcoming environment for current and future patients.”
Zen Leaf Fairless Hills adds another convenient outlet for Philadelphia area patients, and solidifies Verano’s footprint in the state as one of the Company’s 18 affiliated Pennsylvania dispensaries. Verano’s Pennsylvania operations also include a state-of-the-art 62,000 square foot cultivation and processing facility in Chester, where the Company produces its signature Verano Reserve flower and Troches, concentrates and vapes; (the) Essence and Savvy flower and extracts; and Avexia RSO cannabis oil and topicals. For additional convenience and accessibility, patients can choose to order ahead at ZenLeafDispensaries.com for express in-store pickup.
About Verano
Verano Holdings Corp. (Cboe CA: VRNO) (OTCQX: VRNOF), one of the U.S. cannabis industry’s leading companies based on historical revenue, geographic scope and brand performance, is a vertically integrated, multi-state operator embracing a mission of saying Yes to plant progress and the bold exploration of cannabis. Verano provides a superior cannabis shopping experience in medical and adult use markets under the Zen Leaf™ and MÜV™ dispensary banners, including Cabbage Club™, an innovative annual membership program offering exclusive benefits for cannabis consumers. Verano produces a comprehensive suite of high-quality, regulated cannabis products sold under its diverse portfolio of trusted consumer brands including Verano™, (the) Essence™, MÜV™, Savvy™, BITS™, Encore™, and Avexia™. Verano’s active operations span 13 U.S. states, comprised of 13 production facilities with over 1,000,000 square feet of cultivation capacity. Learn more at Verano.com.
Contacts:
Media
Verano
Steve Mazeika
VP, Communications
Steve.Mazeika@verano.com
Investors
Verano
Julianna Paterra, CFA
VP, Investor Relations
Julianna.Paterra@verano.com
Forward Looking Statements
This press release contains “forward-looking statements” within the meaning of the safe harbor provisions of the United States Private Securities Litigation Reform Act of 1995. Such forward-looking statements are not representative of historical facts or information or current condition, but instead represent only the Company’s beliefs regarding future events, plans, strategies, or objectives, many of which, by their nature, are inherently uncertain and outside of the Company’s control. Generally, such forward-looking statements can be identified by the use of forward-looking terminology such as “plans”, “expects” or “does not expect”, “is expected”, “budget”, “future”, “scheduled”, “estimates”, “forecasts”, “projects,” “intends”, “anticipates” or “does not anticipate”, or “believes”, or variations of such words and phrases, or may contain statements that certain actions, events or results “may”, “could”, “would”, “might” or “will be taken”, “will continue”, “will occur” or “will be achieved”. Forward-looking statements involve and are subject to assumptions and known and unknown risks, uncertainties, and other factors which may cause actual events, results, performance, or achievements of the Company to be materially different from future events, results, performance, and achievements expressed or implied by forward-looking statements herein, including, without limitation, the risk factors described in the Company’s annual report on Form 10-K for the year ended December 31, 2023, its quarterly report on Form 10-Q for the quarter ended March 31, 2024 and any subsequent quarterly reports on Form 10-Q, in each case, filed with the U.S. Securities and Exchange Commission at www.sec.gov. The Company makes no assurances and cannot predict the outcome of all or any part of the on-going litigation with Goodness Growth referenced in this press release, including whether the Company will prevail on its Notice of Application and its counterclaim, or whether Goodness Growth will prevail on its claim for damages against the Company. The forward-looking statements contained in this press release are made as of the date of this press release, and the Company does not undertake to update any forward-looking information or forward-looking statements that are contained or referenced herein, except as may be required in accordance with applicable securities laws. All subsequent written and oral forward-looking information and statements attributable to the Company or persons acting on its behalf is expressly qualified in its entirety by this notice regarding forward-looking information and statements.
###
1 Pennsylvania Department of Transportation
2 United States Census Bureau

Cannabis
Unlocking New Horizons in Health: TNR, The Niche Research Reveals the Transformative Power of Minor Cannabinoids
Wilmington, Delaware, July 25, 2024 (GLOBE NEWSWIRE) — Minor cannabinoids refer to the lesser-known compounds found in the cannabis plant, distinct from the well-known THC (tetrahydrocannabinol) and CBD (cannabidiol). While THC and CBD dominate the market, minor cannabinoids such as CBG (cannabigerol), CBC (cannabichromene), and CBN (cannabinol) are gaining attention for their potential therapeutic benefits. These compounds are extracted from both marijuana and hemp plants, with varying legal restrictions depending on their THC content. The minor cannabinoids market is poised for significant growth, driven by increasing consumer awareness and demand for alternative health and wellness products. As regulatory environments around cannabis products evolve, companies are exploring the potential of minor cannabinoids in various applications, including pharmaceuticals, nutraceuticals, cosmetics, and food and beverages.
Minor cannabinoids are being researched for their potential therapeutic effects, including anti-inflammatory, analgesic, and neuroprotective properties. This versatility facilitates product diversification in various industries. Companies are investing in research and development to create novel formulations and delivery methods for minor cannabinoids. This includes nano-emulsions, encapsulation technologies, and controlled-release systems to enhance bioavailability and efficacy. For example, in January 2022, CBDA + CBGA Tincture a new product was launched by Hometown Hero CBD. This 30ml tincture contains 600mg each of CBGA, CBDA, CBG, and CBD. Derived from hemp, the cannabinoids in this tincture comply with legal requirements across all 50 states in the USA. There is an increasing consumer preference for natural as well as plant-based remedies, which in turn is driving the demand for cannabinoid-infused products. This trend is particularly strong among younger demographics seeking alternatives to traditional pharmaceuticals. Evolving regulatory frameworks, particularly in regions like North America and Europe, are creating opportunities for legal market expansion. Regulatory clarity is crucial for market participants to navigate compliance and market entry.
Global Minor Cannabinoids Market: Key Datapoints
|
Market Value in 2023 |
US$ 17.8 Bn |
|
Market Value Forecast by 2034 |
US$ 42.3 Bn |
|
Growth Rate
|
8.2% |
|
Historical Data
|
2016 – 2022 |
|
Base Year
|
2023 |
|
Forecast Data
|
2024 – 2034 |
Increasing consumer interest in health and wellness products, coupled with the perceived therapeutic benefits of cannabinoids, is a major driver of market growth. Progressive cannabis legalization in various parts of the world, including the United States and parts of Europe, is expanding the addressable market for minor cannabinoids. Significant investments in research and development by pharmaceutical and biotechnology companies are accelerating product innovation and clinical trials. The market remains fragmented with opportunities for new entrants and niche players to introduce specialized products catering to specific consumer needs.
The COVID-19 pandemic initially disrupted supply chains and retail channels for minor cannabinoids products. However, the crisis also underscored the importance of health and wellness, leading to increased interest in natural remedies, including cannabinoids. As economies recover, the market is expected to rebound stronger.
The geopolitical tensions, such as the Russia-Ukraine conflict, have also affected global markets, including the minor cannabinoids sector. Fluctuating currency values, supply chain disruptions, and geopolitical uncertainty have impacted production and distribution channels. However, the long-term impact will depend on geopolitical developments and their influence on global trade and regulatory environments.
The minor cannabinoids market presents significant opportunities for growth and innovation, driven by evolving consumer preferences, regulatory advancements, and expanding research initiatives. Companies that can navigate regulatory complexities, invest in research and development, and respond to shifting consumer trends are well-positioned to capitalize on this emerging market. As the market matures, collaboration across sectors and regions will be crucial in unlocking the full potential of minor cannabinoids in various industries worldwide.
Global Minor Cannabinoids Market: Key Takeaways of the Report
- Cannabigerol (CBG) segment by product type is expected to grow at a CAGR of 6.7% in the minor cannabinoids market due to increasing research highlighting its potential therapeutic benefits, including anti-inflammatory, antimicrobial, and neuroprotective properties. As consumer awareness grows and regulatory environments become more favorable, there is heightened interest in CBG-based products for their diverse health applications, ranging from skincare to pharmaceutical formulations, driving sustained market demand and expansion.
- Pharmaceutical segment by application, leads the minor cannabinoids market with a significant revenue share of 35.8% owing to growing recognition of cannabinoids’ potential in therapeutic applications. Cannabinoids like CBD, CBG, and others show promise in treating conditions such as epilepsy, chronic pain, and anxiety disorders, backed by increasing clinical research and favorable regulatory developments. Pharmaceutical companies are investing heavily in cannabinoid-based drug development, driving market growth as they seek to capitalize on these compounds’ efficacy and market potential in addressing unmet medical needs.
- In 2023, Latin America is anticipated as fastest growing region in the global minor cannabinoids market due to evolving regulatory landscapes favoring cannabis legalization and cultivation. This shift is fostering a burgeoning industry infrastructure for cannabis extraction and product development. Additionally, increasing consumer acceptance of cannabinoid-based products for medicinal and wellness purposes is driving market expansion. With a vast potential consumer base and supportive regulatory frameworks, Latin America presents significant growth opportunities for companies seeking to enter or expand within the minor cannabinoids market.
Key Development:
- In December 2023, Rare Cannabinoid Company introduced Uplift Gummies infused with THC and THCV. These gummies combine the relaxing properties of Delta-9-THC with the energizing and appetite-controlling effects of CBD and THCV.
- In October 2022, High Tide Inc., a cannabis retailer, announced that its Colorado-based subsidiary, NuLeaf Naturals, had launched plant-based softgels and full-spectrum multicannabinoid oil in Manitoba. The products feature CBC, CBD, CBG, Delta-9 tetrahydrocannabinol (Delta 9), and CBN.
Browse Related Category Reports
Global Minor Cannabinoids Market:
- Aurora Europe GmbH
- BulKanna
- CBD. INC.
- Fresh Bros Hemp Company
- GCM Holdings, LLC (Global Cannabinoids)
- GenCanna.
- High Purity Natural Products.
- Laurelcrest
- Mile High Labs
- PBG Global
- Rhizo Sciences
- ZERO POINT EXTRACTION, LLC
- Other Industry Participants
Global Minor Cannabinoids Market
By Product Type
- Cannabigerol (CBG)
- Cannabichromene (CBC)
- Cannabinol (CBN)
- Cannabidivarin (CBDV)
- Tetrahydrocannabutol (THCB)
- Tetrahydrocannabivarin (THCV)
- Tetrahydrocannabiphorol (THCP)
- Others
By Application
- Pharmaceutical
- Pain Management
- Mental Health
- Sleep Disorders
- Anti-inflammatory
- Others
- Nutraceuticals
- Cosmetics and Personal Care
- Food and Beverages
- Others
By Region
- North America (U.S., Canada, Mexico, Rest of North America)
- Europe (France, The UK, Spain, Germany, Italy, Nordic Countries (Denmark, Finland, Iceland, Sweden, Norway), Benelux Union (Belgium, The Netherlands, Luxembourg), Rest of Europe)
- Asia Pacific (China, Japan, India, New Zealand, Australia, South Korea, Southeast Asia (Indonesia, Thailand, Malaysia, Singapore, Rest of Southeast Asia), Rest of Asia Pacific)
- Middle East & Africa (Saudi Arabia, UAE, Egypt, Kuwait, South Africa, Rest of Middle East & Africa)
- Latin America (Brazil, Argentina, Rest of Latin America)
Consult with Our Expert:
Jay Reynolds
The Niche Research
Japan (Toll-Free): +81 663-386-8111
South Korea (Toll-Free): +82-808- 703-126
Saudi Arabia (Toll-Free): +966 800-850-1643
United Kingdom: +44 753-710-5080
United States: +1 302-232-5106
Email: askanexpert@thenicheresearch.com
Website: www.thenicheresearch.com
![]()
Cannabis
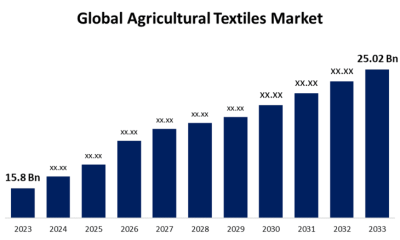
Global Agricultural Textiles Market Size To Worth USD 25.02 Billion By 2033 | CAGR of 4.70%
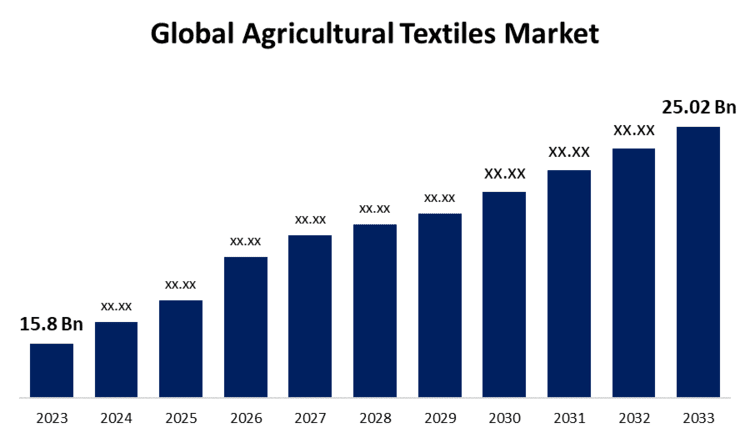
New York, United States , July 23, 2024 (GLOBE NEWSWIRE) — The Global Agricultural Textiles Market Size is to Grow from USD 15.8 Billion in 2023 to USD 25.02 Billion by 2033, at a Compound Annual Growth Rate (CAGR) of 4.70% during the projected period.
Get a Sample PDF Brochure: https://www.sphericalinsights.com/request-sample/5225
Products made of agricultural textiles, or agro textiles, increase productivity, shield farmers from harmful chemicals and pesticides, and keep soil from drying out. The word “agro-textile” has been used recently to refer to materials used in horticulture and agriculture that are knitted, woven, and non-woven. Reducing the use of hazardous pesticides and herbicides promotes a sustainable farming culture and is also good for the environment. Agricultural textiles have remarkable mechanical potential, environmental resistance, simplicity of processing, and durability features that can enhance the safety, quantity, and quality of agricultural products. Textile textiles have been utilized in agriculture for a very long period. Most textile materials are woven or nonwoven in manufacture and are made of synthetic materials in a variety of decompositions. Furthermore, future expansion in the worldwide agricultural textiles market is anticipated to be driven by the rising demand for agricultural products. Any agricultural commodity or product, whether raw or processed, that is derived from livestock is referred to as an agricultural product. Agricultural textiles are used to protect crops from insects and birds, as well as to provide shade for plants, which increases crop yield. Furthermore, going forward, the market for agricultural textiles is expected to be driven by the rise in sustainable agriculture methods. Sustainable farming operations employ socially and environmentally conscious farming methods to increase crop output over the long term, reducing adverse environmental effects, and fostering equitable working conditions for farmers. However, increased raw material costs substantially impede the expansion of the worldwide agricultural textile industry. The rising cost of raw materials is creating challenges for the sector.
Browse key industry insights spread across 193 pages with 112 Market data tables and figures & charts from the Report on the “Global Agricultural Textiles Market Size, Share, and COVID-19 Impact Analysis, By Product (Woven, Knitted, Non-Woven, and Others), By Material (Nylon, Polyethylene, Polypropylene, Polyesters, and Others), By Application (Agriculture, Horticulture, Forestry, Aquaculture, and Others), and By Region (North America, Europe, Asia-Pacific, Latin America, Middle East, and Africa), Analysis and Forecast 2023 – 2033.”
Buy Now Full Report: https://www.sphericalinsights.com/checkout/5225
The knitted segment is anticipated to hold the greatest share of the global agricultural textiles market during the projected timeframe.
Based on the product, the global agricultural textiles market is divided into woven, knitted, non-woven, and others. Among these, the knitted segment is anticipated to hold the greatest share of the global agricultural textiles market during the projected timeframe. The fabric’s multiple applications such as wind control, hail protection, and bird netting are what provide the majority of its revenue. The variety of textiles produced by knitting techniques and the ease of handling knitted fabric has led to a growth in demand for the product. Non-woven fibers can be produced by a variety of techniques, such as chemical bonding, thermal fusion, and mechanical entanglement. A web is created throughout manufacture, adding first mechanical strength and later other properties according to the fiber’s intended use.
The polyethylene segment is expected to grow at the fastest pace in the global agricultural textiles market during the projected timeframe.
Based on the material, the global agricultural textiles market is divided into nylon, polyethylene, polypropylene, polyesters, and others. Among these, the polyethylene segment is expected to grow at the fastest pace in the global agricultural textiles market during the projected timeframe. Thermoplastic polymer polyethylene has a volatile crystalline structure and a wide range of uses, depending on the kind. One of the most widely used materials for agricultural textiles is polyethylene, which is somewhat more expensive than polypropylene. Farm products are covered in HDPE fabrics, which shield them from UV radiation and inclement weather. HDPE Yarns are a useful foundation material for applications including braiding, twisting, and weaving. Technically, they are resistant to both alkalis and acids.
The aquaculture segment is predicted for the highest revenue share in the global agricultural textiles market during the estimated period.
Based on the application, the global agricultural textiles market is divided into agriculture, horticulture, forestry, aquaculture, and others. Among these, the aquaculture segment is predicted for the highest revenue share in the global agricultural textiles market during the estimated period. The demand for seafood is rising, and this has led to an increase in aquaculture and the growth of the fishing net industry. Other industries that have benefited from this growth include nutraceuticals, pharmaceuticals, and cosmetics. The crops that grow under shade nets are chosen depending on how well they tolerate light. They also help to reduce damage from excessive heat and increase agricultural yield in the summer. They are used in a variety of procedures, such as floriculture, nursery operations, and vermicomposting.
Inquire Before Buying This Research Report: https://www.sphericalinsights.com/inquiry-before-buying/5225
Asia Pacific is expected to hold the largest share of the global agricultural textiles market over the forecast period.
Asia Pacific is expected to hold the largest share of the global agricultural textiles market over the forecast period. The region’s noteworthy share can be attributed to the rising demand for agricultural products resulting from changing consumer preferences and population expansion. Due to the significant demand generated by the developing economies of China and India. In addition, China is the biggest consumer since it uses a lot of these textiles for its agricultural and aquaculture sectors. These uses include using nets, mulches, and storage bags to save aquatic life and crops.
North America is predicted to grow at the fastest pace in the global agricultural textiles market during the projected timeframe. Research into more sustainable agriculture practices and consumer interest in organic products will both rise. China is the top region in terms of the agricultural textile market. The region’s expanding aquaculture sector, which generates fish oils, shell meats, and other products, as well as increased domestic consumption, accounts for this development. Policies that support aquaculture at the federal level will drive up demand for these textiles.
Competitive Analysis:
The report offers the appropriate analysis of the key organizations/companies involved within the global market along with a comparative evaluation primarily based on their product offering, business overviews, geographic presence, enterprise strategies, segment market share, and SWOT analysis. The report also provides an elaborative analysis focusing on the current news and developments of the companies, which includes product development, innovations, joint ventures, partnerships, mergers & acquisitions, strategic alliances, and others. This allows for the evaluation of the overall competition within the market. Major vendors in the Global Agricultural Textiles Market include Beaulieu Technical Textiles, Belton Industries, Meyabond, Capatex, Neo Corp International, Garware Technical Fibres, HUESKER Synthetic, Maccaferri, Koninklijke Ten Cate, DuPont de Nemours Inc., Leggett & Platt, SRAM & MRAM Group, Bonar Technical Fabrics, Visaka Industries Limited, and Others.
Get Discount At @ https://www.sphericalinsights.com/request-discount/5225
Recent Developments
- In June 2024, Beaulieu Technical Textiles highlighted performance and sustainability when introducing their Recover and Recover Pro ground covers at GreenTech Amsterdam 2024. Recover uses recycled materials to reduce CO2 emissions and increase durability, while Recover Pro uses volcanic lava rock to improve plant health and water management. The line provides longevity, cannabis, and UV protection.
Market Segment
This study forecasts revenue at global, regional, and country levels from 2020 to 2033. Spherical Insights has segmented the Global Agricultural Textiles Market based on the below-mentioned segments:
Global Agricultural Textiles Market, By Product
- Woven
- Knitted
- Non-Woven
- Others
Global Agricultural Textiles Market, By Material
- Nylon
- Polyethylene
- Polypropylene
- Polyesters
- Others
Global Agricultural Textiles Market, By Application
- Agriculture
- Horticulture
- Forestry
- Aquaculture
- Others
Global Agricultural Textiles Market, Regional Analysis
- North America
- US
- Canada
- Mexico
- Europe
- Germany
- Uk
- France
- Italy
- Spain
- Russia
- Rest of Europe
- Asia Pacific
- China
- Japan
- India
- South Korea
- Australia
- Rest of Asia Pacific
- South America
- Brazil
- Argentina
- Rest of South America
- Middle East & Africa
- UAE
- Saudi Arabia
- Qatar
- South Africa
- Rest of the Middle East & Africa
Browse Related Reports
Global Agriculture Supply Chain Management Market Size, Share, and COVID-19 Impact Analysis, By Component (Hardware, Solutions, and Services), By Solution (Manufacturing Execution System, Procurement & Sourcing, Transportation Management System, Supply Chain Planning, and Warehouse Management System), By Deployment (On-Demand & Cloud-Based, and On-Premise), and By Region (North America, Europe, Asia-Pacific, Latin America, Middle East, and Africa), Analysis and Forecast 2023 – 2033Global Agriculture Supply Chain Management Market Insights Forecasts to 2033
Global Agricultural Haying and Forage Machinery Market Size, Share, and COVID-19 Impact Analysis, By Type (Forage Harvesters, Conditioners, Balers, Mowers, and Others), By Application (Small Farms, Medium Farms, and Large Farms), and By Region (North America, Europe, Asia-Pacific, Latin America, Middle East, and Africa), Analysis and Forecast 2023 – 2033
Global Agricultural Enzymes Market Size, Share, and COVID-19 Impact Analysis, By Product (Phosphatases, Sulfatases, and Dehydrogenases), By Crop Type (Cereals & Grains, Fruits & Vegetables, Turf & Ornamentals, Oilseeds & Pulses, and Others), By Functionality (Plant Growth Regulation, Crop Protection, and Fertility products), and By Region (North America, Europe, Asia-Pacific, Latin America, Middle East, and Africa), Analysis and Forecast 2023 – 2033
Global Agricultural Disinfectants Market Size, Share, and COVID-19 Impact Analysis, By Type (Chemical Disinfectants, Physical Disinfectants, Biological Disinfectants, and Others), By Form (Liquid, Powder, and Others), By Application (Surface, Aerial, Water Sanitizing, and Others), and By Region (North America, Europe, Asia-Pacific, Latin America, Middle East, and Africa), Analysis and Forecast 2023 – 2033
About the Spherical Insights & Consulting
Spherical Insights & Consulting is a market research and consulting firm which provides actionable market research study, quantitative forecasting and trends analysis provides forward-looking insight especially designed for decision makers and aids ROI.
Which is catering to different industry such as financial sectors, industrial sectors, government organizations, universities, non-profits and corporations. The company’s mission is to work with businesses to achieve business objectives and maintain strategic improvements.
CONTACT US:
For More Information on Your Target Market, Please Contact Us Below:
Phone: +1 303 800 4326 (the U.S.)
Phone: +91 90289 24100 (APAC)
Email: inquiry@sphericalinsights.com, sales@sphericalinsights.com
Contact Us: https://www.sphericalinsights.com/contact-us
Follow Us: LinkedIn | Facebook | Twitter


-

 Cannabis2 weeks ago
IM Cannabis Shares Commence Trading on 6:1 Consolidated Basis
-
 Cannabis2 weeks ago
Fractional Flow Reserve Market growing at a CAGR of 15.56% during the forecast period [2024-2030] – Exactitude Consultancy
-
 Cannabis1 week ago
Blank Rome Bolsters Energy Industry Team in Houston and Pittsburgh with Leading Transactional Group
-

 Cannabis1 week ago
Manitoba Harvest Hemp Foods and Brightseed® Introduce New Coffee and Chocolate Flavors in Organic Bioactive Fiber Supplement for Gut Health
-
 Cannabis5 days ago
Europe Medical Cannabis Oil Market Set to Reach Valuation of USD 2,395.83 Million by 2032 | Astute Analytica
-
 Cannabis4 days ago
Global Agricultural Textiles Market Size To Worth USD 25.02 Billion By 2033 | CAGR of 4.70%
-
 Cannabis2 days ago
Unlocking New Horizons in Health: TNR, The Niche Research Reveals the Transformative Power of Minor Cannabinoids
-
Cannabis21 hours ago
Verano Announces the Opening of Zen Leaf Fairless Hills, the Company’s Newest Affiliated Dispensary in Pennsylvania, in Prime New Location