
Cannabis
Village Farms International Reports Third Quarter 2019 Financial Results – Canadian Cannabis JV, Pure Sunfarms, Achieves Fourth Consecutive Quarter of Positive EBITDA, All-In Cost of Production of C$0.63 per Gram, Gross Margin of 69% and EBITDA Margin of 56%
Village Farms International, Inc. (“Village Farms” or the “Company”) (TSX: VFF) (NASDAQ: VFF) today announced its financial results for the third quarter and nine-month period ended September 30, 2019. All figures are in U.S. dollars unless otherwise indicated.
Village Farms’ Financial and Corporate Highlights for the Third Quarter Ended September 30, 2019
(All comparable figures are for the third quarter ended September 30, 2018)
- Produce sales were US$38.3 million compared with US$39.7 million;
- Net loss before tax of (US$6.5 million) and included the loss from Pure Sunfarms Corp. (“Pure Sunfarms”) of (US$0.9 million) (Village Farms’ share based on its 50% ownership). This compares with a net loss before tax of (US$2.7 million);
- Loss per share was (US$0.10) compared with loss per share of (US$0.04);
- EBITDA loss was (US$2.4 million), including the positive contribution from Pure Sunfarms of US$5.0 million (C$6.6 million) (Village Farms’ 50% share). This compares with an EBITDA loss of (US$2.0 million); and
- Subsequent to quarter end, completed a bought deal offering of 3,059,000 common shares at a price of C$9.40 per share for aggregate gross proceeds to the Company of C$28,754,600.
Third Quarter Financial Results for Village Farms’ Canadian Cannabis Joint Venture, Pure Sunfarms
(There were are no comparable results for the third quarter ended September 30, 2018 as no production existed.)
- Net sales (before Village Farms’ 50% share), which consisted entirely of dried cannabis sold predominantly to other licensed producers, were C$24.0 million (US$18.1 million). Late in the third quarter, Pure Sunfarms began shipping branded packaged product to the Ontario Cannabis Store (“OCS”);
- Sales for the third quarter did not include C$7.2 million that was invoiced to Emerald Health Therapeutics (see “Update on Pure Sunfarms’ Supply Agreement with Emerald Health Therapeutics” below);
- Cost of goods sold (“all in cost”) per gram was C$0.63 (US$0.48) per gram;
- Gross margin was 69%;
- Selling, general and administrative expenses (before Village Farms’ 50% share) of C$3.7 million (US$2.8 million) or 12% of revenue;
- Net loss (before Village Farms’ 50% share) of (C$2.4 million) ((US$1.8 million)) which included the non-cash impact of a net charge of (C$12.6 million) due to a change in value of the biological asset; and,
- EBITDA (before Village Farms’ 50% share) was C$13.3 million (US$10.1 million), marking Pure Sunfarms’ fourth consecutive quarter of positive EBITDA and resulting in an EBITDA margin of 56%.
Recent Highlights for Village Farms’ Canadian Cannabis Joint Venture, Pure Sunfarms
- Pure Sunfarms was the top performing brand of dried flower by both kilograms sold and dollar sales with the OCS in October 2019, achieving 16% market share (by kilograms sold). Pure Sunfarms’ dried flower products outsold the second ranked dried flower brand’s products two to one (by kilograms sold). In addition:
- Pure Sunfarms’ Afghan Kush was the top selling dried flower product with the OCS in October;
- Three of the seven top selling dried flower products with the OCS in October were Pure Sunfarms products
Pure Sunfarms shipped its first order of branded dried cannabis products to the OCS in late September (followed by multiple reorders) following receipt from Health Canada on September 6, 2019 of the amendment to its license permitting it to sell and distribute packaged, branded dried cannabis products directly to provincial/territorial wholesalers and authorized private retailers in Canada;
- In B.C., Pure Sunfarms’ sold out its first order to the BC Liquor Distribution Branch (“BCLDB”) (which has since re-ordered) in under three weeks to rank among the top ten brands by sales for all product categories in October. Pure Sunfarms began selling branded, packaged dried cannabis products to the BCLDB in October following entry into a supply agreement in September;
- Completed installation of extraction equipment (with processing capacity of 35,000 kilograms of biomass annually) in its new 65,000 square foot state-of-the-art processing center within the Delta 3 greenhouse facility in preparation for Cannabis 2.0. The processing centre has been designed for full GMP compliance and certification to allow for future exportation, and is expected to be operational as soon as possible, subject to Health Canada licensing and in-house calibration and testing;
- Achieved full run-rate annual production of 75,000 kilograms of dried cannabis at its 1.1 million square foot Delta 3 greenhouse facility; and
- Commenced conversion of the interior of its second 1.1 million square foot greenhouse operation, the Delta 2 greenhouse facility, for cannabis production, which is conservatively expected to double Pure Sunfarms’ annual output at full production to more than 150,000 kilograms. Conversion of the Delta 2 greenhouse facility, which has been designed for full GMP compliance and certification to all for future exportation, remains on schedule, with cannabis production expected to commence during the second quarter of 2020 and the facility is expected to be operating at full run rate production by the end of 2020. Pure Sunfarms has submitted to Health Canada its application for the initial Cultivation License for the Delta 2 greenhouse facility.
Recent Highlights for Village Farms’ U.S. Hemp/CBD Program
The Company’s joint ventures for outdoor hemp production and processing in the U.S. recently completed harvesting of approximately 625 acres of the approximately 870 acres of hemp planted in 2019, achieving an average yield of approximately 1,600 pounds per acre harvested, well in excess of its projections. The Company expects to commence sales of hemp biomass as early as the fourth quarter of 2019.
“We are pleased to report another quarter in which Pure Sunfarms continued to set the standard for performance as a best-in-class cannabis operation, which again drove strong financial performance,” said Michael DeGiglio, Chief Executive Officer, Village Farms. “Pure Sunfarms’ achieved its fourth consecutive quarter of positive EBITDA, with an industry leading all-in cost of production of C$0.63, gross margin of 69% and EBITDA margin of 56%. In the 12 months since adult-use cannabis was legalized in Canada in October 2018, Pure Sunfarms has already generated C$47 million in EBITDA, an especially impressive number given that its operations were ramping up throughout most of that period.”

“Pure Sunfarms is now proving itself as a leading cannabis brand, ranking as the number one selling dried flower brand by a wide margin with the Ontario Cannabis Store in October, and having the overall top selling dried flower product, as well as three of the seven top-selling dried flower product. We look forward to Pure Sunfarms building on this tremendous initial success as it launches its pre-rolled dried products, adds provincial supply agreements, starts its extraction operations online for the roll out of oils and other new product forms under Cannabis 2.0 in the first half of next year, and more than doubles its output, further supporting its low production costs.”
“Pure Sunfarms continues to execute very well on what is under its control. Even as one of the largest Canadian adult-use cannabis suppliers by dollars sold, third quarter sales were constrained by the limited physical retail store infrastructure in Canada, as well as the C$7.2 million that could not be recognized. We built Pure Sunfarms, however, for profitability out of the gate, even in a commoditized environment, and it is one of the few and most profitable Canadian cannabis companies. With industry-leading cost production and a brand and products that are clearly resonating with consumers, Pure Sunfarms remains well positioned to continue to be a dominant supplier as the Canadian adult-use cannabis market continues to develop and expand.”
“In our U.S. outdoor hemp program, we recently completed harvest of our 2019 crop, highlighted by yields that were well above our projections. We remain on track to begin generating profitable hemp sales as early as the fourth quarter of this year. Importantly, our first growing season has provided significant learnings that will be invaluable going forward. In our greenhouse hemp program, we continue to work with Texas Department of Agriculture on the implementation of its hemp regulatory framework subject to the recently published US Department of Agriculture rules and are optimistic that licensing could commence in the first quarter of 2020. As we did in Canada with Pure Sunfarms, we are building a rock-solid foundation of exceptional growing operations from which to aggressively pursue our objective to launch our own white-labelled and branded CBD products in 2020.”
“In our produce business, we continue to make steady progress in the transition of the production displaced for cannabis and hemp production to third-party growing partners, recently adding approximately 120 acres with partners in Mexico and Canada to bring the total to nearly 300 acres. During this period of transition, we will continue to experience some impact on our financial results, more so in some quarters than others, which in the third quarter contributed to a net loss for the produce business of US$5.1 million.”
Update on Pure Sunfarms’ Supply Agreement with Emerald Health Therapeutics
Pursuant to the terms of a Supply Agreement that Pure Sunfarms has with Emerald Health, Emerald has an obligation to purchase 40% of Pure Sunfarms cannabis production at a fixed price, subject to the terms and conditions of the Supply Agreement. To the extent that Emerald does not fulfill its purchase obligation, Pure Sunfarms is able to sell that excess production to other parties in the open market. The Supply Agreement stipulates that Emerald is required to pay Pure Sunfarms the difference between the fixed price and the selling price realized from other parties. During the quarter ended September 30, 2019, Emerald did not fulfill its purchase obligation and Pure Sunfarms sold the product on the open market to arm’s length parties at prices lower than the fixed price in the Supply Agreement. As a result, under the terms of the Supply Agreement, Pure Sunfarms billed Emerald for the difference which amounted to approximately C$7.2 million. On October 15, 2019, Emerald issued a press release that indicated they do not agree that they have any liability with respect to these amounts.
Under IFRS 15 – Revenue from contracts with customers (paragraph 9 (e)), a customer needs to have an intent and ability to pay in order for a company to recognize revenue. Given that Emerald has issued a press release indicating that they do not agree that they have a liability with respect to these amounts, Pure Sunfarms has determined that all of the criteria under IFRS 15 to recognize this revenue were not met as Emerald has demonstrated that they do not have an intent to pay, and as a result has not recorded the revenue related to these amounts.
We understand that Emerald is in the process of investigating its liability to Pure Sunfarms. If Emerald does not agree to the liability, Pure Sunfarms has reserved the right to take such actions as it considers necessary and appropriate to recover its losses from Emerald for non-payment of amounts owing under the Supply Agreement. If Emerald were to agree to the liability in the future, such liability would be recognized in the revenue and profits of Pure Sunfarms, at such time in accordance with generally accepted accounting principles.
Summary Statutory Results
(in thousands of U.S. Dollars unless otherwise indicated)
|
For the three months |
For the Nine months |
||||||
|
2019 |
2018 |
2019 |
2018 |
||||
|
Produce sales |
$38,293 |
$39,684 |
$111,512 |
$111,213 |
|||
|
Cost of sales |
(38,866) |
(36,862) |
(114,711) |
(103,915) |
|||
|
Selling, general and administrative expenses |
(3,739) |
(3,442) |
(11,682) |
(10,486) |
|||
|
Stock compensation expense |
(868) |
(190) |
(3,190) |
(447) |
|||
|
Change in biological asset (1) |
(627) |
(1,189) |
(97) |
(992) |
|||
|
Loss from operations |
(5,807) |
(1,999) |
(18,168) |
(4,627) |
|||
|
Interest expense, net |
(393) |
(618) |
(1,503) |
(1,906) |
|||
|
Foreign exchange gain (loss) |
(183) |
(73) |
338 |
(87) |
|||
|
Other income, net |
69 |
17 |
219 |
61 |
|||
|
Share of income (loss) from joint ventures |
(171) |
(28) |
17,939 |
(369) |
|||
|
Gain on disposal of assets |
(8) |
– |
13,558 |
– |
|||
|
(Provision for) recovery of income taxes |
1,421 |
712 |
81 |
1,513 |
|||
|
Net income (loss) |
(5,072) |
(1,989) |
12,464 |
(5,415) |
|||
|
Consolidated EBITDA (2) |
2,383 |
897 |
8,256 |
1,394 |
|||
|
Earnings (loss) per share – basic |
($0.10) |
($0.04) |
$0.26 |
($0.12) |
|||
|
Earnings (loss) per share – diluted |
($0.10) |
($0.04) |
$0.25 |
($0.12) |
|||
Summary Results Including Joint Ventures, on a Proportionate Basis
The following results reflect the Company’s proportionate share of the Pure Sunfarms joint venture operations, as this is the basis on which management bases its operating decisions and performance. For a reconciliation to the results in accordance with International Financial Reporting Standards (“IFRS”) refer to the “Reconciliation of IFRS to Proportionate Results” as presented below and in Management’s Discussion & Analysis (“MD&A”).
(in thousands of U.S. Dollars unless otherwise indicated)
|
For the three months |
For the six months |
||||||
|
2019(3) |
2018(3) |
2019(3) |
2018(3) |
||||
|
Consolidated sales |
$47,335 |
$39,779 |
$138,076 |
$111,308 |
|||
|
Cost of sales |
(41,711) |
(36,934) |
(121,443) |
($103,987) |
|||
|
Selling, general and administrative expenses |
(5,376) |
(3,756) |
(14,860) |
(11,302) |
|||
|
Change in biological asset (1) |
(4,057) |
(921) |
6,873 |
(564) |
|||
|
Gain on disposal of assets |
(8) |
– |
13,558 |
– |
|||
|
Net income (loss) |
(5,072) |
(1,989) |
12,464 |
(5,415) |
|||
|
EBITDA(2) |
$2,377 |
$897 |
$8,256 |
$1,394 |
|||
|
Earning (loss) per share – basic |
($0.10) |
($0.04) |
$0.26 |
($0.12) |
|||
|
Earning (loss) per share – diluted |
($0.10) |
($0.04) |
$0.25 |
($0.12) |
|||
|
Notes: |
|
|
(1) |
Biological asset consists of the Company’s produce on the vines and Pure Sunfarms’ crop at the period end. Details of the changes are described in note 5 of the Company’s interim condensed consolidated financial statements for the nine months ended September 30, 2019. |
|
(2) |
EBITDA is not a recognized earnings measure and does not have a standardized meaning prescribed by IFRS. Therefore, EBITDA may not be comparable to similar measures presented by other issuers. See “Non-IFRS Measures”. Management believes that EBITDA is a useful supplemental measure in evaluating the performance of the Company. Consolidated EBITDA includes the Company’s 50% interest in Pure Sunfarms, 65% interest in VFH and 60% (effective 63.25% with VFH interest) interest in AVGGH. |
|
(3) |
The consolidated financial results above reflect the proportionate share of the Company’s share of revenues and expenses from its joint venture operations, as this is the basis which management bases its operating decisions and performance evaluation. IFRS does not allow for the inclusion of the joint venture on a proportionate basis. These results include additional non-IFRS measures such as EBITDA. |
|
The results are not generally accepted measures of financial performance under IFRS. The Company’s method of calculating these financial performance measures may differ from other companies and accordingly, they may not be comparable to measures used by other companies. Refer to the MD&A for a reconciliation of these non-IFRS measures and proportionate results. |
Financial Highlights
(All amounts in U.S. Dollars unless otherwise indicated.)
Cannabis
For the three months ended September 30, 2019. There are no comparable results for the three months ended September 30, 2018 as no production existed.
The Company’s 50% share of net sales of Pure Sunfarms for the three months ended September 30, 2019 was $9,042. Total Pure Sunfarms sales consisted of close to approximately 12,000 kilograms of flower and trim sold at an average selling price of over $1.50 per gram (C$2.00 per gram) during the three months ended September 30, 2019. Sales for the three months ended September 30, 2019 were predominantly to other licensed producers and do not include $5.4 million (C$7.2 million) invoiced to Emerald that was not able to be recognized as per the discussion above.
The Company’s 50% share of cost of sales of Pure Sunfarms for the three months ended September 30, 2019 was $2,845.
The Company’s 50% share of selling, general and administrative expenses of Pure Sunfarms for the three months ended September 30, 2019 was $1,415.
The Company’s 50% share of net loss for the three months ended September 30, 2019 was ($918) compared to ($28) for the three months ended September 30, 2018. The net loss for the three months ended September 30, 2019 is due to a change in the biological asset of ($4.8 million).
The Company’s 50% share of EDITDA for the three months ended September 30, 2019 was $5,033 compared to ($12) for the three months ended September 30, 2018.
For the nine months ended September 30, 2019. There are no comparable results for the nine months ended September 30, 2018 as no production existed.
The Company’s 50% share of net sales of Pure Sunfarms for the nine months ended September 30, 2019 was $26,564. Total Pure Sunfarms sales consisted of close to 24,600 kilograms of flower and trim during the nine months ended September 30, 2019, at an average sales price of approximately $2.15 per gram (C$2.85 per gram).
The Company’s 50% share of cost of sales of Pure Sunfarms for the nine months ended September 30, 2019 was $6,732 (based on total grams sold of close to 24,600 kilograms), or approximately $0.55 per gram (C$0.73 per gram).
The Company’s 50% share of selling, general and administrative expenses of Pure Sunfarms for the nine months ended September 30, 2019 was $2,808 and primarily consisted of personnel costs and Health Canada fees.
Income from operations for the Company’s 50% share of Pure Sunfarms was $22,658 for the nine months ended September 30, 2019.
The Company’s 50% share of net income for the nine months ended September 30, 2019 was $17,342 versus a loss of ($369) for the nine months ended September 30, 2018.
The Company’s 50% share of EBITDA for the nine months ended September 30, 2019 was $17,704 versus ($363) for the same period in 2018.
Produce
For the three months ended September 30, 2019 compared to the three months ended September 30, 2018.
Sales for the three months ended September 30, 2019 decreased by ($1,391), or (4%), to $38,293 from $39,684 for the three months ended September 30, 2018. The decrease in sales is primarily due to a decrease in the Company’s product volume, as well as a decrease in supply partner revenue.
Cost of sales for the three months ended September 30, 2019 increased by $2,004, or 5%, to $38,866 from $36,862 for the three months ended September 30, 2018, primarily due to an increase in cost per pound from the Texas facilities, which is due to production issues that caused decreases in production. The decrease in production for the crop causes an increase in cost per pound as most costs are fixed and, as production decreases, cost per pound increases.
For the nine months ended September 30, 2019 compared to the nine months ended September 30, 2018.
Sales for the nine months ended September 30, 2019 increased $299, or less than 1%, to $111,512 compared to $111,213 for the nine months ended September 30, 2018. The increase in net sales is due to an increase in supply partner revenues of 12% over the comparable period in 2018 partially offset by a (14%) decrease in the Company’s production volume. The decrease in the Company’s production volume is primarily due to a clean-out in one of Company’s facilities (which did not occur in the last three years) and ongoing virus pressure at the Company’s Texas facilities.
Cost of sales for the nine months ended September 30, 2019 increased $10,796, or 10%, to $114,711 from $103,915 for the nine months ended September 30, 2018, due to an increase in supply partner purchases of 12% and an increase in the cost per pound of the Company’s own grown product in Texas due to decreased pounds and higher labor costs, due to the higher utilization of hourly rate contract laborers versus Village Farms’ employees for the 2018/2019 crop as compared to the prior crop.
Consolidated EBITDA
EBITDA for the three months ended September 30, 2019 increased by $4,339 to $5,236 from $897 for the three months ended September 30, 2018. The increase is primarily as a result of an increase in the Company’s share of EDITDA from Pure Sunfarms of $7,886 partially offset by an increase in the loss from operations for the Company’s produce business.
EBITDA for the nine months ended September 30, 2019 increased $9,713 to $11,109 from $1,394 for the nine months ended September 30, 2018, primarily as a result of an increase in the Company’s share of income from Pure Sunfarms (Pure Sunfarms EBITDA – $20,558) partially offset by an increase in the loss from the Company’s produce business.
Non-IFRS Measures
References in this MD&A to “EBITDA” are to earnings before interest, taxes, depreciation, amortization, foreign currency exchange gains and losses on translation of long-term debt, unrealized gains on the changes in the value of derivative instruments, unrealized change in biological asset, stock compensation, and gains and losses on asset sales. EBITDA is a cash flow measure that is not recognized under IFRS and does not have a standardized meaning prescribed by IFRS. Therefore, EBITDA may not be comparable to similar measures presented by other issuers. Investors are cautioned that EBITDA should not be construed as an alternative to net income or loss determined in accordance with IFRS as an indicator of the Company’s performance or to cash flows from operating, investing and financing activities as measures of liquidity and cash flows. Management believes that EBITDA is an important measure in evaluating the historical performance of the Company.
Reconciliation of Net Income to EBITDA
The following table reflects a reconciliation of net income to EBITDA, as presented by the Company:
|
(in thousands of U.S. dollars) |
For the three months |
For the nine months |
|||||
|
2019 |
2018 |
2019 |
2018 |
||||
|
Net income (loss) |
($5,072) |
($1,989) |
$12,464 |
($5,415) |
|||
|
Add: |
|||||||
|
Amortization |
1,818 |
1,748 |
5,587 |
5,271 |
|||
|
Foreign currency exchange loss (gain) |
183 |
73 |
(338) |
87 |
|||
|
Interest expense, net |
393 |
618 |
1,503 |
1,906 |
|||
|
Income taxes (recovery) |
(1,421) |
(712) |
(81) |
(1,513) |
|||
|
Stock based compensation |
868 |
190 |
3,190 |
447 |
|||
|
Change in biological asset |
627 |
1,189 |
97 |
992 |
|||
|
Change in biological asset for JV’s |
3,430 |
(267) |
(6,970) |
(428) |
|||
|
Interest expense for JV’s |
249 |
– |
446 |
– |
|||
|
Amortization for JV’s |
244 |
37 |
668 |
37 |
|||
|
Foreign currency exchange loss (gain) for JV’s |
(7) |
10 |
(14) |
10 |
|||
|
Income taxes (recovery) from JV’s |
1,057 |
5,262 |
– |
||||
|
Gain on disposal of assets |
8 |
– |
(13,558) |
– |
|||
|
EBITDA |
$2,377 |
$897 |
$8,256 |
$1,394 |
|||
|
EBITDA for JV’s (See table below) |
$4,806 |
($248) |
$17,331 |
($750) |
|||
|
EBITDA excluding JVs(produce) |
($2,429) |
$1,145 |
($9,076) |
$2,144 |
|||
|
Breakout of JV’s EBITDA (in thousands of U.S. dollars) |
For the three months |
For the nine months |
|||||
|
2019 |
2018 |
2019 |
2018 |
||||
|
Pure Sunfarms EBITDA |
$5,033 |
($248) |
$17,704 |
($750) |
|||
|
VFH EBITDA |
(204) |
– |
(330) |
– |
|||
|
AVGGH EBITDA |
(23) |
– |
(43) |
– |
|||
|
Total JV’s EBITDA |
$4,806 |
($248) |
$17,331 |
($750) |
|||
Reconciliation of IFRS to Proportionate Results
The following tables are a reconciliation of the IFRS results to the proportionate results (which include the Company’s proportionate share of the Pure Sunfarms operations):
|
For the three months ended September 30, 2019 |
||||||||
|
Produce |
PSF(4) |
Hemp(4) |
Total |
|||||
|
Sales |
$38,293 |
$9,042 |
$- |
$47,335 |
||||
|
Cost of sales |
(38,866) |
(2,845) |
– |
(41,711) |
||||
|
Selling, general and administrative expenses |
(3,739) |
(1,415) |
(222) |
(5,376) |
||||
|
Stock compensation expense |
(868) |
– |
– |
(868) |
||||
|
Change in biological asset (5) |
(627) |
(4,765) |
1,336 |
(4,056) |
||||
|
Other income (expense) net |
(507) |
(140) |
(99) |
(746) |
||||
|
(Provision for) recovery of income taxes |
1,421 |
(794) |
(268) |
359 |
||||
|
Net income (loss) |
($4,901) |
($918) |
$747 |
($5,072) |
||||
|
EBITDA (6) |
($2,422) |
$5,033 |
($227) |
$2,383 |
||||
|
Earnings (loss) per share – basic |
($0.10) |
($0.02) |
$0.02 |
($0.10) |
||||
|
Earnings (loss) per share – diluted |
($0.10) |
($0.01) |
$0.01 |
($0.10) |
||||
|
For the three months ended September 30, 2018 |
||||||||
|
Produce |
PSF(4) |
Hemp(4) |
Total |
|||||
|
Sales |
$39,684 |
$95 |
– |
$39,779 |
||||
|
Cost of sales |
(36,862) |
(72) |
– |
(36,934) |
||||
|
Selling, general and administrative expenses |
(3,442) |
(314) |
– |
(3,756) |
||||
|
Stock compensation expense |
(190) |
– |
– |
(190) |
||||
|
Change in biological asset (5) |
(1,189) |
268 |
– |
(921) |
||||
|
Other income (expense) net |
(674) |
(5) |
– |
(679) |
||||
|
Recovery of income taxes |
712 |
– |
– |
712 |
||||
|
Net income (loss) |
($1,961) |
($28) |
– |
($1,989) |
||||
|
EBITDA (6) |
$1,145 |
($248) |
– |
$897 |
||||
|
Earnings (loss) per share – basic |
($0.03) |
($0.01) |
– |
($0.04) |
||||
|
Earnings (loss) per share – diluted |
($0.03) |
($0.01) |
– |
($0.04) |
||||
|
For the nine months ended September 30, 2019 |
|||||||
|
Produce |
PSF(4) |
Hemp(4) |
Total |
||||
|
Sales |
$111,512 |
$26,568 |
– |
$138,076 |
|||
|
Cost of sales |
(114,711) |
(6,732) |
– |
(121,443) |
|||
|
Selling, general and administrative expenses |
(11,682) |
(2,808) |
(370) |
(14,860) |
|||
|
Stock compensation expense |
(3,190) |
– |
– |
(3,190) |
|||
|
Change in biological asset (5) |
(97) |
5,634 |
1,336 |
6,873 |
|||
|
Gain on disposal of assets |
13,558 |
– |
– |
13,558 |
|||
|
Other income (expense) net |
(946) |
(273) |
(150) |
(1,369) |
|||
|
(Provision for) recovery of for income taxes |
81 |
(5,043) |
(219) |
(5,181) |
|||
|
Net income (loss) |
($5,475) |
$17,342 |
$597 |
$12,464 |
|||
|
EBITDA (6) |
($9,076) |
$17,704 |
($373) |
$8,256 |
|||
|
Earnings (loss) per share – basic |
($0.11) |
$0.36 |
$0.01 |
$0.26 |
|||
|
Earnings (loss) per share – diluted |
($0.11) |
$0.34 |
$0.01 |
$0.25 |
|||
|
For the nine months ended September 30, 2018 |
||||||||
|
Produce |
PSF(4) |
Hemp(4) |
Total |
|||||
|
Sales |
$111,213 |
$95 |
$- |
$111,308 |
||||
|
Cost of sales |
(103,915) |
(72) |
– |
($103,987) |
||||
|
Selling, general and administrative expenses |
(10,486) |
(816) |
– |
(11,302) |
||||
|
Stock compensation expense |
(447) |
– |
(447) |
|||||
|
Change in biological asset (5) |
(992) |
428 |
– |
(564) |
||||
|
(Gain) loss on sale of assets |
– |
– |
– |
– |
||||
|
Other income (expense) net |
(1,932) |
(5) |
– |
(1,937) |
||||
|
Recovery of income taxes |
1,513 |
– |
– |
1,513 |
||||
|
Net income (loss) |
($5,046) |
($369) |
$- |
($5,415) |
||||
|
EBITDA (6) |
$2,149 |
($750) |
$- |
$1,394 |
||||
|
Earnings (loss) per share – basic |
($0.11) |
($0.01) |
$- |
($0.12) |
||||
|
Earnings (loss) per share – diluted |
($0.11) |
($0.01) |
$- |
($0.12) |
||||
|
Notes: |
||
|
(4) |
The adjusted consolidated financial results have been adjusted to include the Company’s share of revenues and expenses from its Pure Sunfarms and Hemp joint ventures on a proportionate accounting basis, on which management bases its operating decisions and performance evaluation. IFRS does not allow for the inclusion of the Joint Venture on a proportionate basis. These results include additional non-IFRS measures such as EBITDA. |
|
|
The adjusted results are not generally accepted measures of financial performance under IFRS. The Company’s method of calculating these financial performance measures may differ from other companies and accordingly, they may not be comparable to measures used by other companies. Refer to the MD&A for a reconciliation of these non-IFRS measures and adjusted results. |
||
|
(5) |
Biological asset consists of the Company’s produce on the vines and Pure Sunfarms’ crop at the period end. Details of the changes are described in note 5 of the Company’s interim condensed consolidated financial statements for the nine months ended September 30, 2019. |
|
|
(6) |
EBITDA is not a recognized earnings measure and does not have a standardized meaning prescribed by IFRS. Therefore, EBITDA may not be comparable to similar measures presented by other issuers. See “Non-IFRS Measures”. Management believes that EBITDA is a useful supplemental measure in evaluating the performance of the Company. Consolidated EBITDA includes the Company’s 50% interest Pure Sunfarms, 65% interest in VFH and 60% (effective 63.25% with VFH interest) interest in AVGGH. |
|
Conference Call
Village Farms’ management team will host a conference call Friday, November 15, 2019 at 8:30 a.m. ET to discuss its third quarter 2019 financial results. Participants can access the conference call by telephone by dialing (647) 427-7450 or (888) 231-8191, or via the Internet at: https://bit.ly/2Wm7dxj.
For those unable to participate in the conference call at the scheduled time, it will be archived for replay both by telephone and via the Internet beginning approximately one hour following completion of the call. To access the archived conference call by telephone, dial (416) 849-0833 or (855) 859-2056 and enter the passcode 4987345 followed by the pound key. The telephone replay will be available until Friday, November 22, 2019 at midnight (ET). The conference call will also be archived on Village Farms’ website at http://villagefarms.com/investor-relations/investor-calls.


Cannabis
Verano Announces the Opening of Zen Leaf Fairless Hills, the Company’s Newest Affiliated Dispensary in Pennsylvania, in Prime New Location
- Zen Leaf Fairless Hills, the Company’s newest affiliated dispensary in Pennsylvania, relocated from its former home in Chester to 203 Lincoln Highway, a busy thoroughfare with daily traffic of over 17,000 vehicles per day1
- As the first medical cannabis dispensary in the city, Zen Leaf Fairless Hills will offer an elevated experience for area patients, including increased convenience and accessibility with numerous point-of-sale stations and kiosks for seamless in-store browsing and ordering
- Verano’s active operations span 13 states, comprised of 142 dispensaries and 13 cultivation and processing facilities with more than 1 million square feet of cultivation capacity
CHICAGO, July 26, 2024 (GLOBE NEWSWIRE) — Verano Holdings Corp. (Cboe CA: VRNO) (OTCQX: VRNOF) (“Verano” or the “Company”), a leading multi-state cannabis company, today announced the opening of Zen Leaf Fairless Hills in Pennsylvania on Friday, July 26th, following a ceremonial ribbon cutting at 11 a.m. local time. Zen Leaf Fairless Hills is located at 203 Lincoln Highway and will be open Monday through Saturday from 9 a.m. to 8 p.m. and Sunday from 10 a.m. to 6 p.m. local time.
The dispensary is located in Bucks County, the fourth largest county in the Commonwealth with a total population of over 630,0002 residents. To increase accessibility and convenience, Zen Leaf Fairless Hills features large in-store kiosks and numerous point-of-sale stations to enhance the browsing and ordering experience for patients. To celebrate the grand opening of Zen Leaf Fairless Hills and following a ceremonial ribbon cutting, patients will be greeted with complimentary deals and doorbusters on featured branded products.
“We are excited to bring the Zen Leaf experience to local patients in Fairless Hills, where our talented team members will continue to deliver hospitality-driven care and top-quality products for local patients,” said George Archos, Verano Founder and Chief Executive Officer. “As the Pennsylvania medical cannabis patient population continues to grow, we are grateful for the opportunity to deepen our roots in Bucks County at our newest Zen Leaf location in the Commonwealth, and look forward to providing a warm and welcoming environment for current and future patients.”
Zen Leaf Fairless Hills adds another convenient outlet for Philadelphia area patients, and solidifies Verano’s footprint in the state as one of the Company’s 18 affiliated Pennsylvania dispensaries. Verano’s Pennsylvania operations also include a state-of-the-art 62,000 square foot cultivation and processing facility in Chester, where the Company produces its signature Verano Reserve flower and Troches, concentrates and vapes; (the) Essence and Savvy flower and extracts; and Avexia RSO cannabis oil and topicals. For additional convenience and accessibility, patients can choose to order ahead at ZenLeafDispensaries.com for express in-store pickup.
About Verano
Verano Holdings Corp. (Cboe CA: VRNO) (OTCQX: VRNOF), one of the U.S. cannabis industry’s leading companies based on historical revenue, geographic scope and brand performance, is a vertically integrated, multi-state operator embracing a mission of saying Yes to plant progress and the bold exploration of cannabis. Verano provides a superior cannabis shopping experience in medical and adult use markets under the Zen Leaf™ and MÜV™ dispensary banners, including Cabbage Club™, an innovative annual membership program offering exclusive benefits for cannabis consumers. Verano produces a comprehensive suite of high-quality, regulated cannabis products sold under its diverse portfolio of trusted consumer brands including Verano™, (the) Essence™, MÜV™, Savvy™, BITS™, Encore™, and Avexia™. Verano’s active operations span 13 U.S. states, comprised of 13 production facilities with over 1,000,000 square feet of cultivation capacity. Learn more at Verano.com.
Contacts:
Media
Verano
Steve Mazeika
VP, Communications
Steve.Mazeika@verano.com
Investors
Verano
Julianna Paterra, CFA
VP, Investor Relations
Julianna.Paterra@verano.com
Forward Looking Statements
This press release contains “forward-looking statements” within the meaning of the safe harbor provisions of the United States Private Securities Litigation Reform Act of 1995. Such forward-looking statements are not representative of historical facts or information or current condition, but instead represent only the Company’s beliefs regarding future events, plans, strategies, or objectives, many of which, by their nature, are inherently uncertain and outside of the Company’s control. Generally, such forward-looking statements can be identified by the use of forward-looking terminology such as “plans”, “expects” or “does not expect”, “is expected”, “budget”, “future”, “scheduled”, “estimates”, “forecasts”, “projects,” “intends”, “anticipates” or “does not anticipate”, or “believes”, or variations of such words and phrases, or may contain statements that certain actions, events or results “may”, “could”, “would”, “might” or “will be taken”, “will continue”, “will occur” or “will be achieved”. Forward-looking statements involve and are subject to assumptions and known and unknown risks, uncertainties, and other factors which may cause actual events, results, performance, or achievements of the Company to be materially different from future events, results, performance, and achievements expressed or implied by forward-looking statements herein, including, without limitation, the risk factors described in the Company’s annual report on Form 10-K for the year ended December 31, 2023, its quarterly report on Form 10-Q for the quarter ended March 31, 2024 and any subsequent quarterly reports on Form 10-Q, in each case, filed with the U.S. Securities and Exchange Commission at www.sec.gov. The Company makes no assurances and cannot predict the outcome of all or any part of the on-going litigation with Goodness Growth referenced in this press release, including whether the Company will prevail on its Notice of Application and its counterclaim, or whether Goodness Growth will prevail on its claim for damages against the Company. The forward-looking statements contained in this press release are made as of the date of this press release, and the Company does not undertake to update any forward-looking information or forward-looking statements that are contained or referenced herein, except as may be required in accordance with applicable securities laws. All subsequent written and oral forward-looking information and statements attributable to the Company or persons acting on its behalf is expressly qualified in its entirety by this notice regarding forward-looking information and statements.
###
1 Pennsylvania Department of Transportation
2 United States Census Bureau

Cannabis
Unlocking New Horizons in Health: TNR, The Niche Research Reveals the Transformative Power of Minor Cannabinoids
Wilmington, Delaware, July 25, 2024 (GLOBE NEWSWIRE) — Minor cannabinoids refer to the lesser-known compounds found in the cannabis plant, distinct from the well-known THC (tetrahydrocannabinol) and CBD (cannabidiol). While THC and CBD dominate the market, minor cannabinoids such as CBG (cannabigerol), CBC (cannabichromene), and CBN (cannabinol) are gaining attention for their potential therapeutic benefits. These compounds are extracted from both marijuana and hemp plants, with varying legal restrictions depending on their THC content. The minor cannabinoids market is poised for significant growth, driven by increasing consumer awareness and demand for alternative health and wellness products. As regulatory environments around cannabis products evolve, companies are exploring the potential of minor cannabinoids in various applications, including pharmaceuticals, nutraceuticals, cosmetics, and food and beverages.
Minor cannabinoids are being researched for their potential therapeutic effects, including anti-inflammatory, analgesic, and neuroprotective properties. This versatility facilitates product diversification in various industries. Companies are investing in research and development to create novel formulations and delivery methods for minor cannabinoids. This includes nano-emulsions, encapsulation technologies, and controlled-release systems to enhance bioavailability and efficacy. For example, in January 2022, CBDA + CBGA Tincture a new product was launched by Hometown Hero CBD. This 30ml tincture contains 600mg each of CBGA, CBDA, CBG, and CBD. Derived from hemp, the cannabinoids in this tincture comply with legal requirements across all 50 states in the USA. There is an increasing consumer preference for natural as well as plant-based remedies, which in turn is driving the demand for cannabinoid-infused products. This trend is particularly strong among younger demographics seeking alternatives to traditional pharmaceuticals. Evolving regulatory frameworks, particularly in regions like North America and Europe, are creating opportunities for legal market expansion. Regulatory clarity is crucial for market participants to navigate compliance and market entry.
Global Minor Cannabinoids Market: Key Datapoints
|
Market Value in 2023 |
US$ 17.8 Bn |
|
Market Value Forecast by 2034 |
US$ 42.3 Bn |
|
Growth Rate
|
8.2% |
|
Historical Data
|
2016 – 2022 |
|
Base Year
|
2023 |
|
Forecast Data
|
2024 – 2034 |
Increasing consumer interest in health and wellness products, coupled with the perceived therapeutic benefits of cannabinoids, is a major driver of market growth. Progressive cannabis legalization in various parts of the world, including the United States and parts of Europe, is expanding the addressable market for minor cannabinoids. Significant investments in research and development by pharmaceutical and biotechnology companies are accelerating product innovation and clinical trials. The market remains fragmented with opportunities for new entrants and niche players to introduce specialized products catering to specific consumer needs.
The COVID-19 pandemic initially disrupted supply chains and retail channels for minor cannabinoids products. However, the crisis also underscored the importance of health and wellness, leading to increased interest in natural remedies, including cannabinoids. As economies recover, the market is expected to rebound stronger.
The geopolitical tensions, such as the Russia-Ukraine conflict, have also affected global markets, including the minor cannabinoids sector. Fluctuating currency values, supply chain disruptions, and geopolitical uncertainty have impacted production and distribution channels. However, the long-term impact will depend on geopolitical developments and their influence on global trade and regulatory environments.
The minor cannabinoids market presents significant opportunities for growth and innovation, driven by evolving consumer preferences, regulatory advancements, and expanding research initiatives. Companies that can navigate regulatory complexities, invest in research and development, and respond to shifting consumer trends are well-positioned to capitalize on this emerging market. As the market matures, collaboration across sectors and regions will be crucial in unlocking the full potential of minor cannabinoids in various industries worldwide.
Global Minor Cannabinoids Market: Key Takeaways of the Report
- Cannabigerol (CBG) segment by product type is expected to grow at a CAGR of 6.7% in the minor cannabinoids market due to increasing research highlighting its potential therapeutic benefits, including anti-inflammatory, antimicrobial, and neuroprotective properties. As consumer awareness grows and regulatory environments become more favorable, there is heightened interest in CBG-based products for their diverse health applications, ranging from skincare to pharmaceutical formulations, driving sustained market demand and expansion.
- Pharmaceutical segment by application, leads the minor cannabinoids market with a significant revenue share of 35.8% owing to growing recognition of cannabinoids’ potential in therapeutic applications. Cannabinoids like CBD, CBG, and others show promise in treating conditions such as epilepsy, chronic pain, and anxiety disorders, backed by increasing clinical research and favorable regulatory developments. Pharmaceutical companies are investing heavily in cannabinoid-based drug development, driving market growth as they seek to capitalize on these compounds’ efficacy and market potential in addressing unmet medical needs.
- In 2023, Latin America is anticipated as fastest growing region in the global minor cannabinoids market due to evolving regulatory landscapes favoring cannabis legalization and cultivation. This shift is fostering a burgeoning industry infrastructure for cannabis extraction and product development. Additionally, increasing consumer acceptance of cannabinoid-based products for medicinal and wellness purposes is driving market expansion. With a vast potential consumer base and supportive regulatory frameworks, Latin America presents significant growth opportunities for companies seeking to enter or expand within the minor cannabinoids market.
Key Development:
- In December 2023, Rare Cannabinoid Company introduced Uplift Gummies infused with THC and THCV. These gummies combine the relaxing properties of Delta-9-THC with the energizing and appetite-controlling effects of CBD and THCV.
- In October 2022, High Tide Inc., a cannabis retailer, announced that its Colorado-based subsidiary, NuLeaf Naturals, had launched plant-based softgels and full-spectrum multicannabinoid oil in Manitoba. The products feature CBC, CBD, CBG, Delta-9 tetrahydrocannabinol (Delta 9), and CBN.
Browse Related Category Reports
Global Minor Cannabinoids Market:
- Aurora Europe GmbH
- BulKanna
- CBD. INC.
- Fresh Bros Hemp Company
- GCM Holdings, LLC (Global Cannabinoids)
- GenCanna.
- High Purity Natural Products.
- Laurelcrest
- Mile High Labs
- PBG Global
- Rhizo Sciences
- ZERO POINT EXTRACTION, LLC
- Other Industry Participants
Global Minor Cannabinoids Market
By Product Type
- Cannabigerol (CBG)
- Cannabichromene (CBC)
- Cannabinol (CBN)
- Cannabidivarin (CBDV)
- Tetrahydrocannabutol (THCB)
- Tetrahydrocannabivarin (THCV)
- Tetrahydrocannabiphorol (THCP)
- Others
By Application
- Pharmaceutical
- Pain Management
- Mental Health
- Sleep Disorders
- Anti-inflammatory
- Others
- Nutraceuticals
- Cosmetics and Personal Care
- Food and Beverages
- Others
By Region
- North America (U.S., Canada, Mexico, Rest of North America)
- Europe (France, The UK, Spain, Germany, Italy, Nordic Countries (Denmark, Finland, Iceland, Sweden, Norway), Benelux Union (Belgium, The Netherlands, Luxembourg), Rest of Europe)
- Asia Pacific (China, Japan, India, New Zealand, Australia, South Korea, Southeast Asia (Indonesia, Thailand, Malaysia, Singapore, Rest of Southeast Asia), Rest of Asia Pacific)
- Middle East & Africa (Saudi Arabia, UAE, Egypt, Kuwait, South Africa, Rest of Middle East & Africa)
- Latin America (Brazil, Argentina, Rest of Latin America)
Consult with Our Expert:
Jay Reynolds
The Niche Research
Japan (Toll-Free): +81 663-386-8111
South Korea (Toll-Free): +82-808- 703-126
Saudi Arabia (Toll-Free): +966 800-850-1643
United Kingdom: +44 753-710-5080
United States: +1 302-232-5106
Email: askanexpert@thenicheresearch.com
Website: www.thenicheresearch.com
![]()
Cannabis
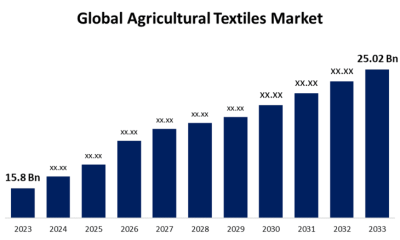
Global Agricultural Textiles Market Size To Worth USD 25.02 Billion By 2033 | CAGR of 4.70%
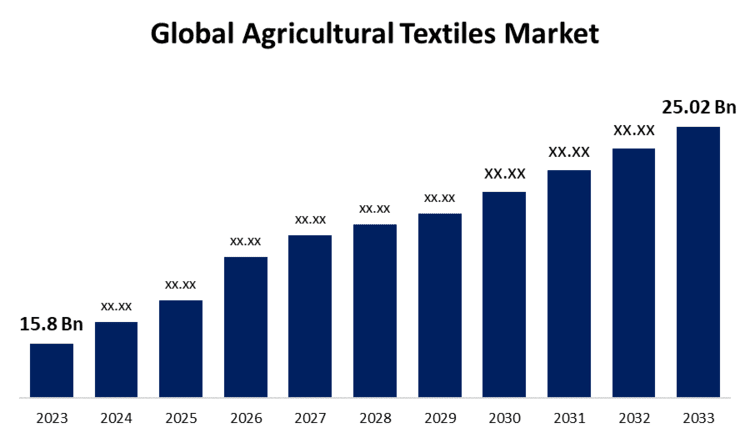
New York, United States , July 23, 2024 (GLOBE NEWSWIRE) — The Global Agricultural Textiles Market Size is to Grow from USD 15.8 Billion in 2023 to USD 25.02 Billion by 2033, at a Compound Annual Growth Rate (CAGR) of 4.70% during the projected period.
Get a Sample PDF Brochure: https://www.sphericalinsights.com/request-sample/5225
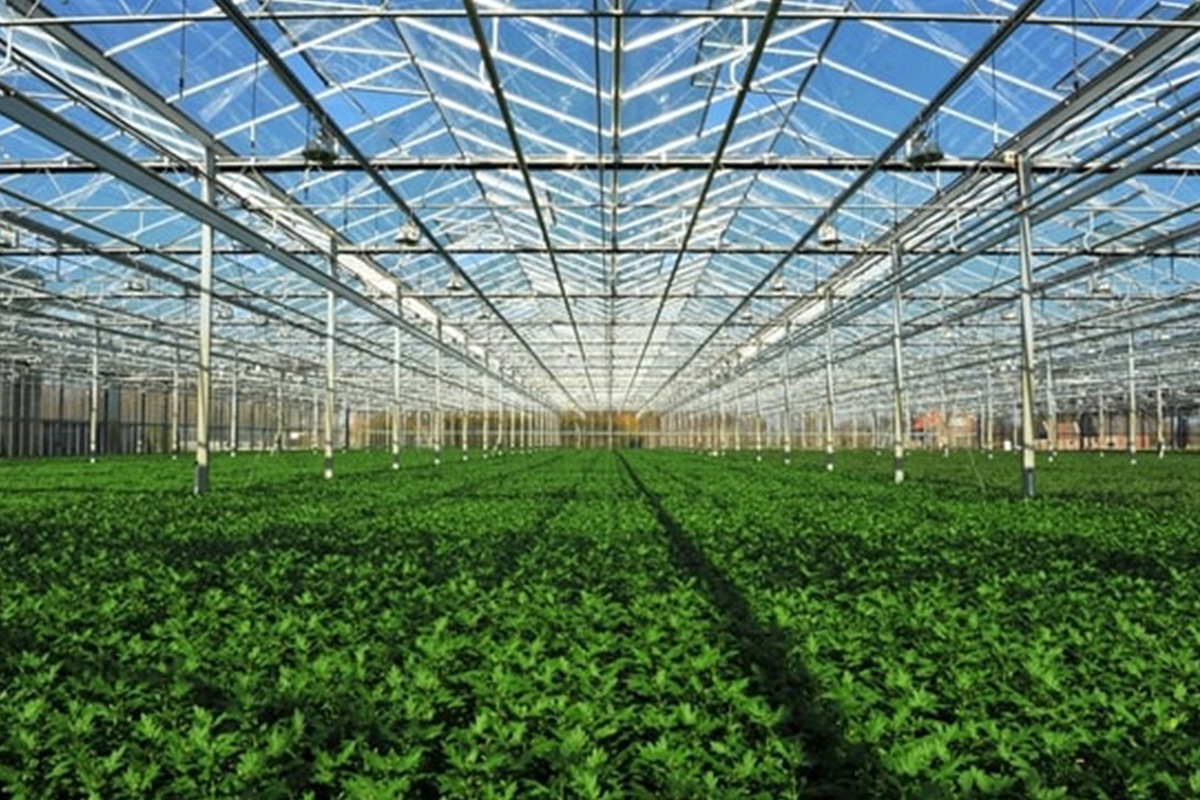
Products made of agricultural textiles, or agro textiles, increase productivity, shield farmers from harmful chemicals and pesticides, and keep soil from drying out. The word “agro-textile” has been used recently to refer to materials used in horticulture and agriculture that are knitted, woven, and non-woven. Reducing the use of hazardous pesticides and herbicides promotes a sustainable farming culture and is also good for the environment. Agricultural textiles have remarkable mechanical potential, environmental resistance, simplicity of processing, and durability features that can enhance the safety, quantity, and quality of agricultural products. Textile textiles have been utilized in agriculture for a very long period. Most textile materials are woven or nonwoven in manufacture and are made of synthetic materials in a variety of decompositions. Furthermore, future expansion in the worldwide agricultural textiles market is anticipated to be driven by the rising demand for agricultural products. Any agricultural commodity or product, whether raw or processed, that is derived from livestock is referred to as an agricultural product. Agricultural textiles are used to protect crops from insects and birds, as well as to provide shade for plants, which increases crop yield. Furthermore, going forward, the market for agricultural textiles is expected to be driven by the rise in sustainable agriculture methods. Sustainable farming operations employ socially and environmentally conscious farming methods to increase crop output over the long term, reducing adverse environmental effects, and fostering equitable working conditions for farmers. However, increased raw material costs substantially impede the expansion of the worldwide agricultural textile industry. The rising cost of raw materials is creating challenges for the sector.
Browse key industry insights spread across 193 pages with 112 Market data tables and figures & charts from the Report on the “Global Agricultural Textiles Market Size, Share, and COVID-19 Impact Analysis, By Product (Woven, Knitted, Non-Woven, and Others), By Material (Nylon, Polyethylene, Polypropylene, Polyesters, and Others), By Application (Agriculture, Horticulture, Forestry, Aquaculture, and Others), and By Region (North America, Europe, Asia-Pacific, Latin America, Middle East, and Africa), Analysis and Forecast 2023 – 2033.”
Buy Now Full Report: https://www.sphericalinsights.com/checkout/5225
The knitted segment is anticipated to hold the greatest share of the global agricultural textiles market during the projected timeframe.
Based on the product, the global agricultural textiles market is divided into woven, knitted, non-woven, and others. Among these, the knitted segment is anticipated to hold the greatest share of the global agricultural textiles market during the projected timeframe. The fabric’s multiple applications such as wind control, hail protection, and bird netting are what provide the majority of its revenue. The variety of textiles produced by knitting techniques and the ease of handling knitted fabric has led to a growth in demand for the product. Non-woven fibers can be produced by a variety of techniques, such as chemical bonding, thermal fusion, and mechanical entanglement. A web is created throughout manufacture, adding first mechanical strength and later other properties according to the fiber’s intended use.
The polyethylene segment is expected to grow at the fastest pace in the global agricultural textiles market during the projected timeframe.
Based on the material, the global agricultural textiles market is divided into nylon, polyethylene, polypropylene, polyesters, and others. Among these, the polyethylene segment is expected to grow at the fastest pace in the global agricultural textiles market during the projected timeframe. Thermoplastic polymer polyethylene has a volatile crystalline structure and a wide range of uses, depending on the kind. One of the most widely used materials for agricultural textiles is polyethylene, which is somewhat more expensive than polypropylene. Farm products are covered in HDPE fabrics, which shield them from UV radiation and inclement weather. HDPE Yarns are a useful foundation material for applications including braiding, twisting, and weaving. Technically, they are resistant to both alkalis and acids.
The aquaculture segment is predicted for the highest revenue share in the global agricultural textiles market during the estimated period.
Based on the application, the global agricultural textiles market is divided into agriculture, horticulture, forestry, aquaculture, and others. Among these, the aquaculture segment is predicted for the highest revenue share in the global agricultural textiles market during the estimated period. The demand for seafood is rising, and this has led to an increase in aquaculture and the growth of the fishing net industry. Other industries that have benefited from this growth include nutraceuticals, pharmaceuticals, and cosmetics. The crops that grow under shade nets are chosen depending on how well they tolerate light. They also help to reduce damage from excessive heat and increase agricultural yield in the summer. They are used in a variety of procedures, such as floriculture, nursery operations, and vermicomposting.
Inquire Before Buying This Research Report: https://www.sphericalinsights.com/inquiry-before-buying/5225
Asia Pacific is expected to hold the largest share of the global agricultural textiles market over the forecast period.
Asia Pacific is expected to hold the largest share of the global agricultural textiles market over the forecast period. The region’s noteworthy share can be attributed to the rising demand for agricultural products resulting from changing consumer preferences and population expansion. Due to the significant demand generated by the developing economies of China and India. In addition, China is the biggest consumer since it uses a lot of these textiles for its agricultural and aquaculture sectors. These uses include using nets, mulches, and storage bags to save aquatic life and crops.
North America is predicted to grow at the fastest pace in the global agricultural textiles market during the projected timeframe. Research into more sustainable agriculture practices and consumer interest in organic products will both rise. China is the top region in terms of the agricultural textile market. The region’s expanding aquaculture sector, which generates fish oils, shell meats, and other products, as well as increased domestic consumption, accounts for this development. Policies that support aquaculture at the federal level will drive up demand for these textiles.
Competitive Analysis:
The report offers the appropriate analysis of the key organizations/companies involved within the global market along with a comparative evaluation primarily based on their product offering, business overviews, geographic presence, enterprise strategies, segment market share, and SWOT analysis. The report also provides an elaborative analysis focusing on the current news and developments of the companies, which includes product development, innovations, joint ventures, partnerships, mergers & acquisitions, strategic alliances, and others. This allows for the evaluation of the overall competition within the market. Major vendors in the Global Agricultural Textiles Market include Beaulieu Technical Textiles, Belton Industries, Meyabond, Capatex, Neo Corp International, Garware Technical Fibres, HUESKER Synthetic, Maccaferri, Koninklijke Ten Cate, DuPont de Nemours Inc., Leggett & Platt, SRAM & MRAM Group, Bonar Technical Fabrics, Visaka Industries Limited, and Others.
Get Discount At @ https://www.sphericalinsights.com/request-discount/5225
Recent Developments
- In June 2024, Beaulieu Technical Textiles highlighted performance and sustainability when introducing their Recover and Recover Pro ground covers at GreenTech Amsterdam 2024. Recover uses recycled materials to reduce CO2 emissions and increase durability, while Recover Pro uses volcanic lava rock to improve plant health and water management. The line provides longevity, cannabis, and UV protection.
Market Segment
This study forecasts revenue at global, regional, and country levels from 2020 to 2033. Spherical Insights has segmented the Global Agricultural Textiles Market based on the below-mentioned segments:
Global Agricultural Textiles Market, By Product
- Woven
- Knitted
- Non-Woven
- Others
Global Agricultural Textiles Market, By Material
- Nylon
- Polyethylene
- Polypropylene
- Polyesters
- Others
Global Agricultural Textiles Market, By Application
- Agriculture
- Horticulture
- Forestry
- Aquaculture
- Others
Global Agricultural Textiles Market, Regional Analysis
- North America
- US
- Canada
- Mexico
- Europe
- Germany
- Uk
- France
- Italy
- Spain
- Russia
- Rest of Europe
- Asia Pacific
- China
- Japan
- India
- South Korea
- Australia
- Rest of Asia Pacific
- South America
- Brazil
- Argentina
- Rest of South America
- Middle East & Africa
- UAE
- Saudi Arabia
- Qatar
- South Africa
- Rest of the Middle East & Africa
Browse Related Reports
Global Agriculture Supply Chain Management Market Size, Share, and COVID-19 Impact Analysis, By Component (Hardware, Solutions, and Services), By Solution (Manufacturing Execution System, Procurement & Sourcing, Transportation Management System, Supply Chain Planning, and Warehouse Management System), By Deployment (On-Demand & Cloud-Based, and On-Premise), and By Region (North America, Europe, Asia-Pacific, Latin America, Middle East, and Africa), Analysis and Forecast 2023 – 2033Global Agriculture Supply Chain Management Market Insights Forecasts to 2033
Global Agricultural Haying and Forage Machinery Market Size, Share, and COVID-19 Impact Analysis, By Type (Forage Harvesters, Conditioners, Balers, Mowers, and Others), By Application (Small Farms, Medium Farms, and Large Farms), and By Region (North America, Europe, Asia-Pacific, Latin America, Middle East, and Africa), Analysis and Forecast 2023 – 2033
Global Agricultural Enzymes Market Size, Share, and COVID-19 Impact Analysis, By Product (Phosphatases, Sulfatases, and Dehydrogenases), By Crop Type (Cereals & Grains, Fruits & Vegetables, Turf & Ornamentals, Oilseeds & Pulses, and Others), By Functionality (Plant Growth Regulation, Crop Protection, and Fertility products), and By Region (North America, Europe, Asia-Pacific, Latin America, Middle East, and Africa), Analysis and Forecast 2023 – 2033
Global Agricultural Disinfectants Market Size, Share, and COVID-19 Impact Analysis, By Type (Chemical Disinfectants, Physical Disinfectants, Biological Disinfectants, and Others), By Form (Liquid, Powder, and Others), By Application (Surface, Aerial, Water Sanitizing, and Others), and By Region (North America, Europe, Asia-Pacific, Latin America, Middle East, and Africa), Analysis and Forecast 2023 – 2033
About the Spherical Insights & Consulting
Spherical Insights & Consulting is a market research and consulting firm which provides actionable market research study, quantitative forecasting and trends analysis provides forward-looking insight especially designed for decision makers and aids ROI.
Which is catering to different industry such as financial sectors, industrial sectors, government organizations, universities, non-profits and corporations. The company’s mission is to work with businesses to achieve business objectives and maintain strategic improvements.
CONTACT US:
For More Information on Your Target Market, Please Contact Us Below:
Phone: +1 303 800 4326 (the U.S.)
Phone: +91 90289 24100 (APAC)
Email: inquiry@sphericalinsights.com, sales@sphericalinsights.com
Contact Us: https://www.sphericalinsights.com/contact-us
Follow Us: LinkedIn | Facebook | Twitter


-
 Cannabis2 weeks ago
IM Cannabis Shares Commence Trading on 6:1 Consolidated Basis
-
 Cannabis1 week ago
Blank Rome Bolsters Energy Industry Team in Houston and Pittsburgh with Leading Transactional Group
-
 Cannabis2 weeks ago
Fractional Flow Reserve Market growing at a CAGR of 15.56% during the forecast period [2024-2030] – Exactitude Consultancy
-
 Cannabis1 week ago
Manitoba Harvest Hemp Foods and Brightseed® Introduce New Coffee and Chocolate Flavors in Organic Bioactive Fiber Supplement for Gut Health
-
 Cannabis4 days ago
Europe Medical Cannabis Oil Market Set to Reach Valuation of USD 2,395.83 Million by 2032 | Astute Analytica
-
 Cannabis4 days ago
Global Agricultural Textiles Market Size To Worth USD 25.02 Billion By 2033 | CAGR of 4.70%
-
 Cannabis1 day ago
Unlocking New Horizons in Health: TNR, The Niche Research Reveals the Transformative Power of Minor Cannabinoids
-
Cannabis15 hours ago
Verano Announces the Opening of Zen Leaf Fairless Hills, the Company’s Newest Affiliated Dispensary in Pennsylvania, in Prime New Location